
Over the weekend, U.S. officials announced the capture of Venezuelan President Nicolás Maduro and his wife, who were transported to New York to face charges related to drug trafficking and narco-terrorism. The events that unfolded in Venezuela could lead to instability in the markets to start the year. As always, we caution you against making knee-jerk decisions or reactions to breaking news.
History suggests that markets tend to digest geopolitical shocks over time, as the chart below illustrates, and we believe equity markets should look through the headlines and focus on the long run. Venezuela is a small global player, but it does have the highest proven oil reserves, according to OPEC. The infrastructure to harvest those reserves is limited, however, and it is premature to lay out a long-term assessment of the oil market based on last weekend’s developments.
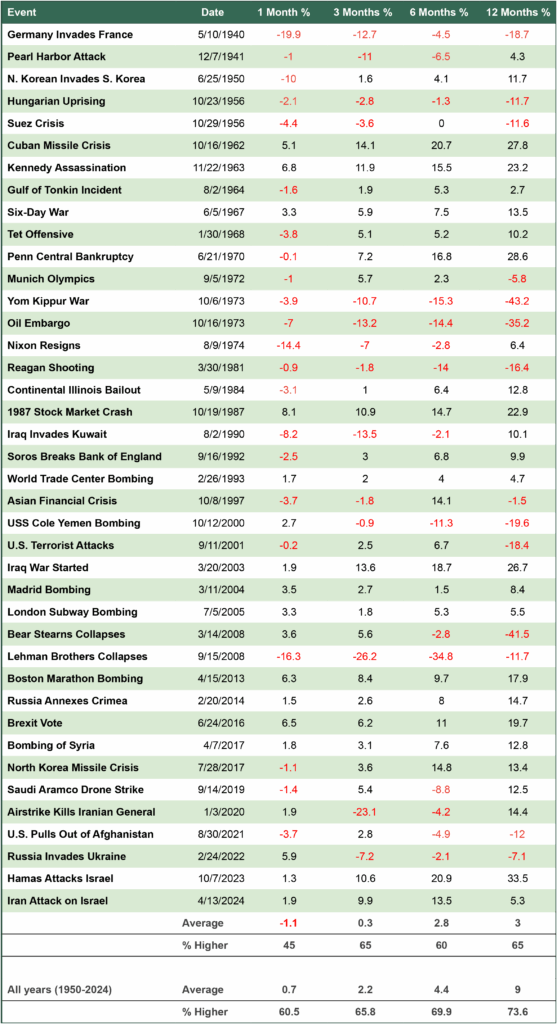
How Markets Have Responded to Major World Events
This view of how the S&P 500 Index responded after geopolitical shocks shows that over time, markets tend to adapt and refocus on economic fundamentals. In about two-thirds of cases, markets were higher a year after the event, even when the initial reaction was sharply negative.
Looking Back at 2025
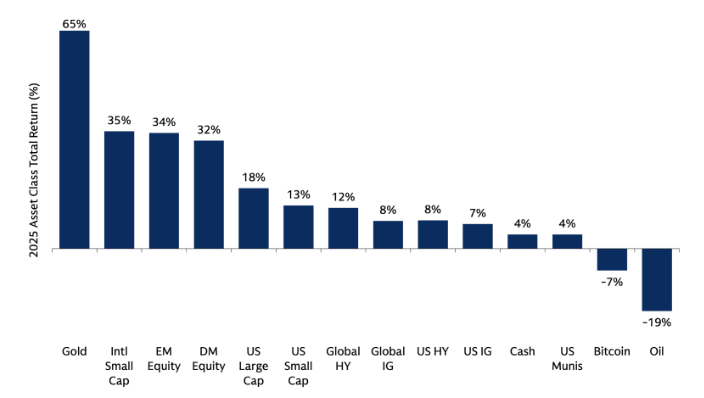
Last year was a strong one for investors, as stocks made new highs around the world, and bonds had their best year since 2020. Commodities gained overall, with gold and silver soaring to new highs. Bitcoin and oil were the two major assets that had negative returns.
As a reminder, it wasn’t always smooth sailing in 2025. Between mid-February and early April, the S&P 500 suffered a near bear market (down 19% at the low point). The NASDAQ and the Russell 2000 both fell 24% during that same timeframe.
Since the closing low on April 8, the market had a great rally and closed in higher double digits for the third consecutive year. But even then, the line wasn’t straight up, as both the NASDAQ and Russell 2000 experienced almost 10% pullbacks after April 8, and the S&P fell 5%. Only two of the Magnificent Seven stocks — Alphabet and Nvidia — outperformed the S&P. The other five underperformed both the S&P and the NASDAQ. International Equities dominated U.S. stocks, driven by a decline in the dollar and attractive valuations outside of the U.S.
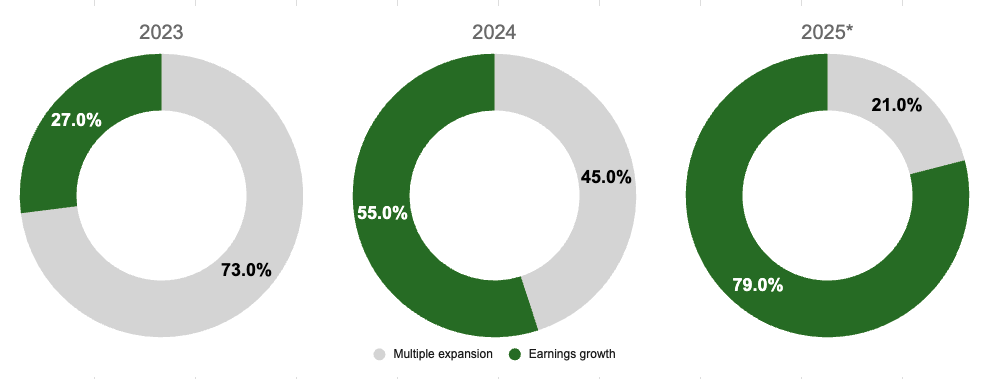
Last year’s returns were driven by earnings growth and profitability, a sturdier foundation for stocks than just multiple expansion. In 2025, earnings growth drove 79% of the S&P 500’s return — up from 55% in 2024 and 27% in 2023, when the Magnificent Seven drove most of the returns.
Growth broadened last year, with financials, utilities and materials enjoying double-digit profit growth. All 11 sectors of the S&P 500 saw positive returns, with real estate achieving the lowest performance.
What’s Driving Market Returns?
In the last three years, earnings growth has eclipsed multiple expansion as the main contribution to S&P 500 returns.
Looking Ahead to 2026
No one knows what will happen in the stock market this year. We do know that there will be bad days and scary headlines — such as the latest Venezuela news in just the first week. Market outlooks are good exercises as we try to predict the market, the economy, and what the new year may look like, but market dynamics don’t follow the calendar.
Some economic themes like artificial intelligence remain strong, but they change in complexion as AI continues to mature and grow. Other themes like tariffs, inflation, housing supply, profit margins, labor supply altered by immigration shifts, and interest rates continue to be top of mind for economists and market predictors.
Inflation remains persistent as both tariffs and labor shortages push costs higher. We also don’t know if the One Big Beautiful Bill will stimulate consumers and businesses or what effect it may have on the market.
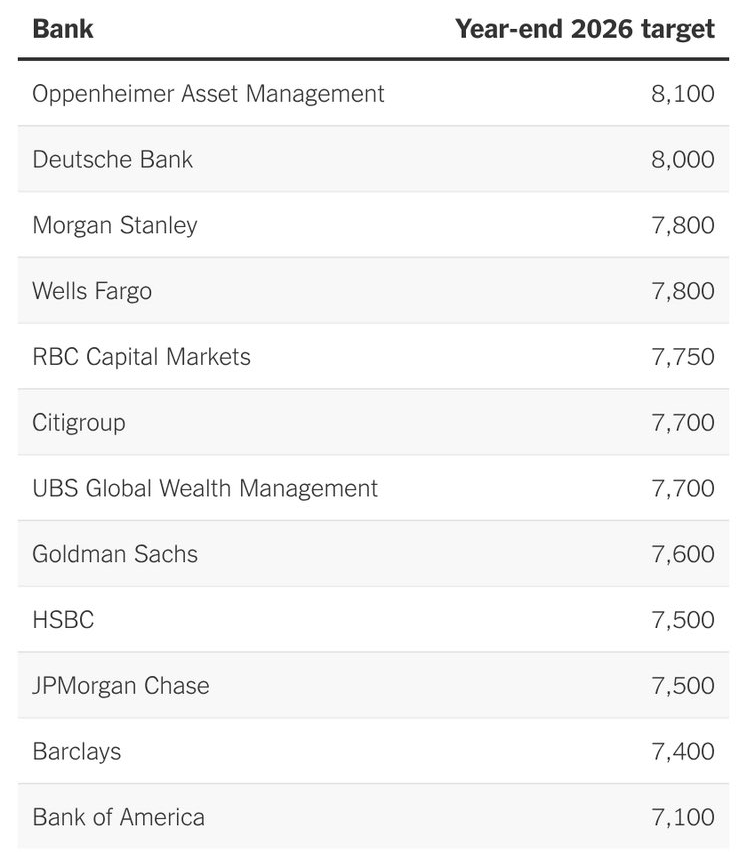
As the chart below shows, 2026 predictions for the S&P 500 range from a low of 7,100 to a high of 8,100. The average of the top banks’ predictions is 7,663, which would imply an almost 12% gain for the year. On the low end, the predicted return is 3.73%, and on the high end, it is over 18%.
These estimates will change throughout the year, with economists updating their predictions based on current events and fluctuations. These same strategists were bullish heading into 2025 but later cut their forecast around Liberation Day, only to readjust it after stocks began to take off.
Wall Street’s Predictions for the S&P 500

The CD Wealth Formula
We help our clients reach and maintain financial stability by following a specific plan, catered to each client.
Our focus remains on long-term investing with a strategic allocation while maintaining a tactical approach. Our decisions to make changes are calculated and well thought out, looking at where we see the economy heading. We are anticipating and moving to those areas of strength in the economy and in the stock market.
We will continue to focus on the fact that what really matters right now is time in the market, not out of the market. That means staying the course and continuing to invest, even when the markets dip, to take advantage of potential market upturns. We continue to adhere to the proven disciplines of diversification, periodic rebalancing, and forward-looking strategies, while avoiding reliance on stale retrospective data.
It is important to focus on the long-term goal, not on one specific data point or indicator. Long-term fundamentals are what matter. In markets and moments like these, it is essential to stick to the financial plan. Investing is about following a disciplined process over time.
Sources: Carson, CNBC, DealBook, Goldman Sachs, S&P


