Last Friday, stocks capped off a volatile week of trading after the previous day’s release of the Consumer Price Index (CPI) for September came in hotter than expected. Initially, this weighed on the markets as investors braced for the Federal Reserve to continue aggressively raising rates. After the release of the CPI report on Thursday, the S&P 500 opened down more than 2.4%, but by the end of the day, we had witnessed the fifth-largest intraday reversal from a low. The S&P 500 ended up 2.6% Thursday, reinforcing just how volatile this market is – much like previous bear markets. Then on Friday, the S&P gave back the gains from the day before, ending down 1.55% for the week.
The increase in volatility is not just in the stock market. Volatility has spiked in a range of markets from currencies to bonds, raising concern about the ability of the global economy to cope with higher U.S. rates. If these trends continue, the Fed may moderate its pace of tightening and slow the pace of reducing its balance sheet. The dollar has surged to new all-time highs on a trade-weighted basis, driven by a combination of relatively high U.S. yields and demand for safe-haven assets during global political turmoil. Fed officials have made it clear that financial market volatility alone will not affect their rate decisions.
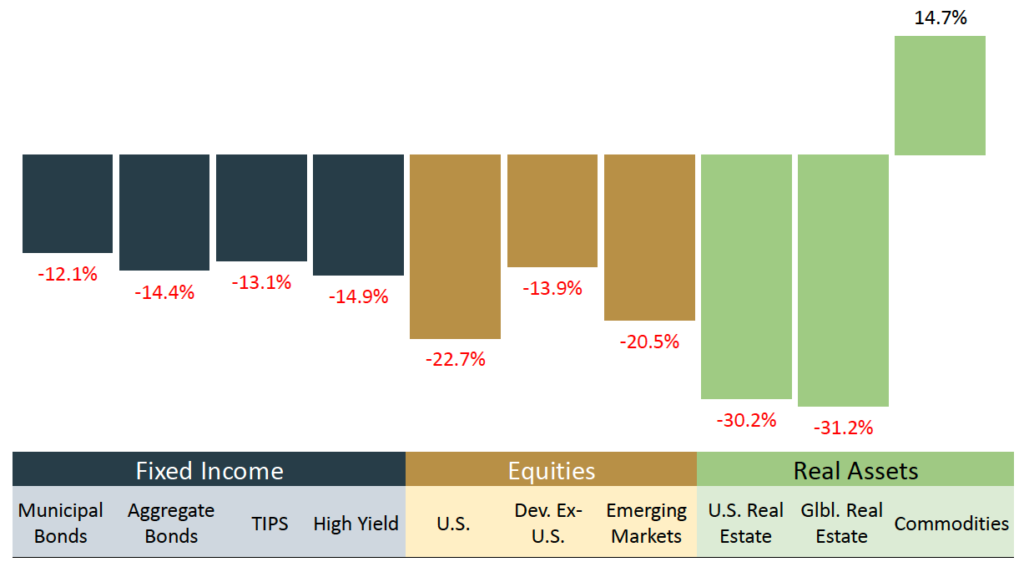
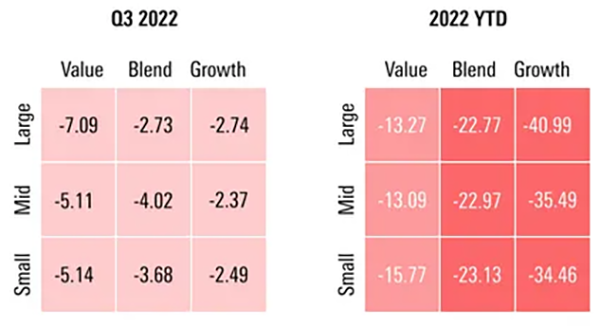
As seen in the bar chart below, the only positive asset class other than cash through the first three quarters of the year has been commodities. (And gold, the most well-known commodity, is down almost 10% year to date.) In some instances, bonds are down as much as stocks this year. This begs the question: Is asset allocation dead? Does the old-style box chart investing —allocating money into growth and value, small cap, mid cap, large cap and international stocks as well as in bonds, as seen in the second chart below — not work anymore?
U.S. Markets YTD % Returns

U.S. Equity Style Box Performance

For investors whose experience this year has them questioning asset allocation, the following may provide perspective on why we believe it remains effective.
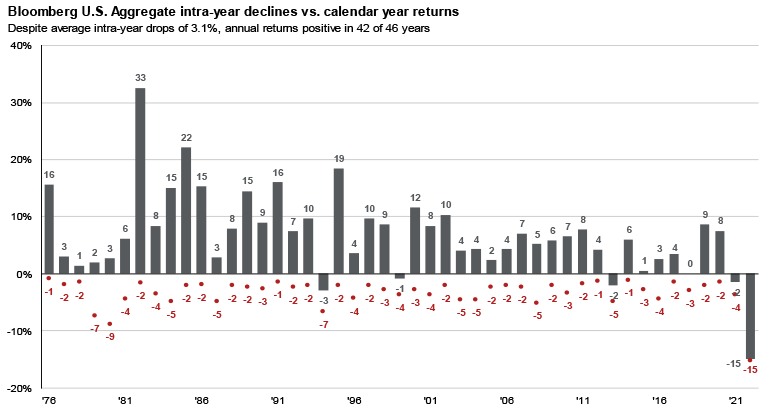
• What we have seen in 2022 is unusual. The aggregate bond index (AGG) has been around since 1976. Since that time, the index has been negative four times, the worst being a decline of 2.9% in 1994. In each of those years, the S&P 500 has been higher by an average of more than 20%. This year appears to be an anomaly.
• The picture is more complicated on a quarterly basis. Since 1970, the S&P 500 has had 50 negative quarters, and the AGG has been lower in 16 of them. During the worst quarter of 2008, when stocks were down the most, the AGG was up. The third quarter of 1981 had been the worst quarter for the AGG until the second quarter of this year. The chart below shows the AGG’s total return each year. The red dots show the largest peak-to-trough decline each year. The average intra-year decline has been 3.2% versus an average decline of 14% for stocks. Historically, after bad years of performance, bonds tend to deliver strong returns in the years that follow.
Bloomberg U.S. Aggregate Annual Returns and Intra-Year Declines

• Bonds can go down as well as stocks. The historical correlation between the S&P 500 and the AGG is close to zero. Stocks and bonds tend to each go their own ways relative to performance, rather than moving in decidedly opposite directions. It is also important to remember that bonds, like stocks, can and will go down, especially in an environment of rising interest rates.
• Dislocations can create opportunities. We do not think that traditional asset allocation is dead. While all but cash and commodities are negative this year, stock and bond valuations have improved. Diversification within stocks and bonds will continue to add value to a portfolio. Vanguard’s chief economist for the Americas, Roger Aliaga-Diaz, recently commented that “market volatility means diversified portfolio returns will always remain uneven, comprising periods of higher or lower – and, yes, even negative returns.” He went on to add:
“The broader, more important issue is the effectiveness of a diversified portfolio, balanced across asset classes, in keeping with the investor’s risk tolerance and time horizon.”
The CD Wealth Formula
We help our clients reach and maintain financial stability by following a specific plan, catered to each client.
Our focus remains on long-term investing with a strategic allocation while maintaining a tactical approach. Our decisions to make changes are calculated and well thought out, looking at where we see the economy is heading. We are not guessing or market timing. We are anticipating and moving to those areas of strength in the economy — and in the stock market.
We will continue to focus on the fact that what really matters right now is time in the market, not out of the market. That means staying the course and continuing to invest, even when the markets dip, to take advantage of potential market upturns. We continue to adhere to the tried-and-true disciplines of diversification, periodic rebalancing and looking forward, while not making investment decisions based on where we have been.
It is important to focus on the long-term goal, not on one specific data point or indicator. Long-term fundamentals are what matter. In markets and moments like these, it is essential to stick to the financial plan. Investing is about following a disciplined process over time.
Sources: Kestra Investment Management, Morningstar, CNBC, Vanguard, JP Morgan
This material contains an assessment of the market and economic environment at a specific point in time and is not intended to be a forecast of future events, or a guarantee of future results. Forward-looking statements are subject to certain risks and uncertainties. Actual results, performance, or achievements may differ materially from those expressed or implied. Information is based on data gathered from what we believe are reliable sources.
Using diversification as part of your investment strategy neither assures nor guarantees better performance and cannot protect against loss of principal due to changing market conditions.
Past performance is not a guarantee of future results.
The opinions expressed in this commentary are those of the author and may not necessarily reflect those held by Kestra Investment Services, LLC or Kestra Advisory Services, LLC. This is for general information only and is not intended to provide specific investment advice or recommendations for any individual. It is suggested that you consult your financial professional, attorney, or tax advisor with regard to your individual situation.
Securities offered through Kestra Investment Services, LLC (Kestra IS), member FINRA/SIPC. Investment Advisory Services offered through Kestra Advisory Services, LLC (Kestra AS) an affiliate of Kestra IS. CD Wealth Management and Bluespring Wealth Partners LLC* are affiliates of Kestra IS and Kestra AS. Investor Disclosures: https://bit.ly/KF-Disclosures
*Bluespring Wealth Partners, LLC acquires and supports high quality investment adviser and wealth management companies throughout the United States.


