
The Federal Reserve kept the benchmark Federal Funds Rate unchanged for the second meeting in a row. As we wrote last week, Treasury yields have risen sharply since September. Longer maturity bonds had taken the brunt of the pain over the last few months, as the 10-year Treasury briefly eclipsed the 5% level, which had not been seen since 2007.
Along with the pain in the bond market, the stock market experienced a correction with stocks down more than 10% from their recent peak. Investors may still have some PTSD from 2022, when both stocks and bonds were down at the same time, but that was a rare occurrence.
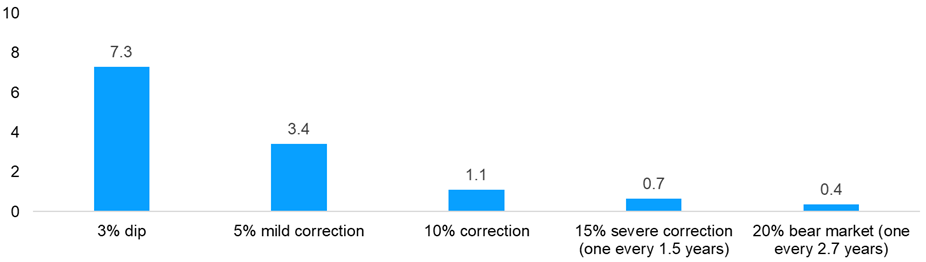
Market corrections are normal. There have been corrections in 22 of the past 44 years, and according to Ned Davis research, there are 1.1 corrections per year on average going back to 1950. This suggests that the market falling 10% or more in a year is a normal occurrence, but each time it happens, the occurrence feels unique.
Volatility Is the Toll We Pay to Invest
S&P 500 per year (1950-2022)
Last week, the stock and bond markets rallied after the Fed announcement and the weaker-than-expected payroll report, which limited concerns of a recession. The 10-year Treasury bond yield fell to almost 4.5%, well off the recent 5% yield reached two weeks ago. As bond yields fell, stocks surged, marking the best week of the year.
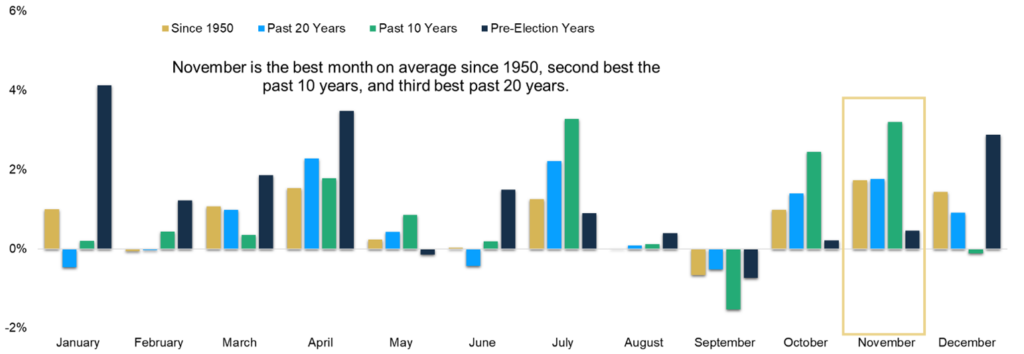
Historically, November and December have been strong months in the market, and November has been the best month of the year, gaining 1.7% on average. The strength in the month of November may be tied to the fact that August, September and October have historically been the weakest three-month stretch of the year. Another interesting tidbit: December has been strong in pre-election years, which is the case this year as we head into 2024.
November Is the Best Month of the Year
S&P 500 Index average monthly returns (1950-2022)
From a portfolio management perspective, we continue to look ahead. The markets are forward-looking, often telling us what may happen ahead of time. We continue to watch and wait for the most anticipated recession in history. Inflation continues to show signs of weakening but remains persistently — and stubbornly — above the targeted 2% level.
With an eye on the future, we are making the following portfolio changes as we end the year:
1. Through the end of October, only two sectors had positive year-to-date returns: technology and consumer discretionary. Every other sector was negative. The “Magnificent Seven” tech stocks — Alphabet, Amazon, Apple, Meta, Microsoft, Nvidia and Tesla — were the main reason the S&P 500 had a positive return through October. The broadening of the market away from those seven names had yet to materialize.
Healthcare, which historically has been a sector to own in a struggling economy, has been underperforming over the last several years. This is partly due to pressures on drug pricing as well as higher interest rates hurting less profitable companies in the faster-growing biotechnology space. We have decided to reduce our exposure to healthcare and move those monies to a holding that focuses on companies that display positive fundamentals: return on equity, stable earnings growth and lower financial leverage.
2. We have continued to increase the duration of the fixed-income portfolio as interest rates have continued to climb. The longer-dated maturities at the end of the yield curve are more volatile than the short end of the yield curve.
For example, in the chart below, let’s start by looking at the 5-Year Treasury row and the 0-bps column (4.58%). If interest rates were to rise by 100 basis points (1%), you would theoretically earn 1.08% over that time frame. However, if interest rates dropped by 50 basis points (.50%) in the next year, you would earn 6.39% in total.
By comparison, let’s look at the 10-year Treasury bond, a longer maturity bond than the 5-year Treasury. If rates were to rise by 1%, you would lose 2.64%; if rates were to fall by .5%, the potential rate of return would be 8.25%. Because we believe we are near the end of the Fed rate increases, we are continuing to extend the duration of the portfolio and increase the credit quality by adding a position in longer-dated Treasuries. We believe that when rates fall, we will be able to capture nice income along with capital appreciation from rising bond prices.
Interest Rate Scenario Analysis
This analysis illustrates the total return of the U.S. Treasury security of a set maturity, over a given time period and a range of interest rate shifts.

We continue to reposition the portfolio in response to where we think the puck is moving. The world in which interest rates stay higher for longer is not one we have been accustomed to for the last 15 years. Financial markets, both stocks and bonds, may be more volatile in response.
With higher yields for longer periods, investors are being compensated in cash through money market and CDs. However, as soon as the Fed lowers the Federal Funds Rate, we will see those yields fall rapidly. We think much of the pain from rising interest rates is behind us, and the key to navigating volatility still is to be in a diversified portfolio. We will continue to monitor the portfolio and make changes to skate toward the puck, rather than wait for the puck to come to us.
The CD Wealth Formula
We help our clients reach and maintain financial stability by following a specific plan, catered to each client.
Our focus remains on long-term investing with a strategic allocation while maintaining a tactical approach. Our decisions to make changes are calculated and well thought out, looking at where we see the economy is heading. We are not guessing or market timing. We are anticipating and moving to those areas of strength in the economy — and in the stock market.
We will continue to focus on the fact that what really matters right now is time in the market, not out of the market. That means staying the course and continuing to invest, even when the markets dip, to take advantage of potential market upturns. We continue to adhere to the tried-and-true disciplines of diversification, periodic rebalancing and looking forward, while not making investment decisions based on where we have been.
It is important to focus on the long-term goal, not on one specific data point or indicator. Long-term fundamentals are what matter. In markets and moments like these, it is essential to stick to the financial plan. Investing is about following a disciplined process over time.
Sources: Bloomberg, Carson, CNBC, Ned Davis, Wealth of Common Sense

This material contains an assessment of the market and economic environment at a specific point in time and is not intended to be a forecast of future events, or a guarantee of future results. Forward-looking statements are subject to certain risks and uncertainties. Actual results, performance, or achievements may differ materially from those expressed or implied. Information is based on data gathered from what we believe are reliable sources.
Using diversification as part of your investment strategy neither assures nor guarantees better performance and cannot protect against loss of principal due to changing market conditions.
Past performance is not a guarantee of future results.
The opinions expressed in this commentary are those of the author and may not necessarily reflect those held by Kestra Investment Services, LLC or Kestra Advisory Services, LLC. This is for general information only and is not intended to provide specific investment advice or recommendations for any individual. It is suggested that you consult your financial professional, attorney, or tax advisor with regard to your individual situation.
Securities offered through Kestra Investment Services, LLC (Kestra IS), member FINRA/SIPC. Investment Advisory Services offered through Kestra Advisory Services, LLC (Kestra AS) an affiliate of Kestra IS. CD Wealth Management and Bluespring Wealth Partners LLC* are affiliates of Kestra IS and Kestra AS. Investor Disclosures: https://bit.ly/KF-Disclosures
*Bluespring Wealth Partners, LLC acquires and supports high quality investment adviser and wealth management companies throughout the United States.
Fidelity Investments and Fidelity Institutional® (together “Fidelity”) is an independent company, unaffiliated with Kestra Financial or CD Wealth Management. Fidelity is a service provider to both. There is no form of legal partnership, agency affiliation, or similar relationship between your financial advisor and Fidelity, nor is such a relationship created or implied by the information herein. Fidelity has not been involved with the preparation of the content supplied by CD Wealth Management and does not guarantee, or assume any responsibility for, its content. Fidelity Investments is a registered service mark of FMR LLC. Fidelity Institutional provides clearing, custody, or other brokerage services through National Financial Services LLC or Fidelity Brokerage Services LLC, Members NYSE, SIPC.


