
Stocks have picked up right where we left off at the end of 2023. Last week, the S&P 500 officially closed above 5,000 for the first time — and in a little less than three years, the S&P has gained more than 1,000 points.
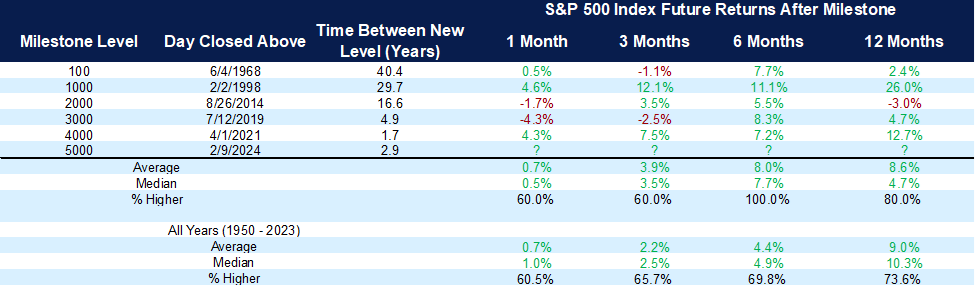
The chart below looks at where stocks traded one month, three months, six months and one year after each of the major milestones for the S&P 500. On average, stocks are up 8.6% one year after these major milestones.
5,000 Is Here, Now What?
S&P 500 returns after major milestones
Just a year ago, investors were being bombarded with talk of an imminent recession. We now have a healthy economy with inflation well off highs from 2022, a Federal Reserve bank indicating rate cuts are likely to occur in 2024, improving productivity and stocks at all-time highs.
Stocks have rallied over 22% during the past 4 months. The S&P 500 finished higher 14 of the last 15 weeks – something that hasn’t happened since 1972. A downturn would be perfectly normal following this rally.
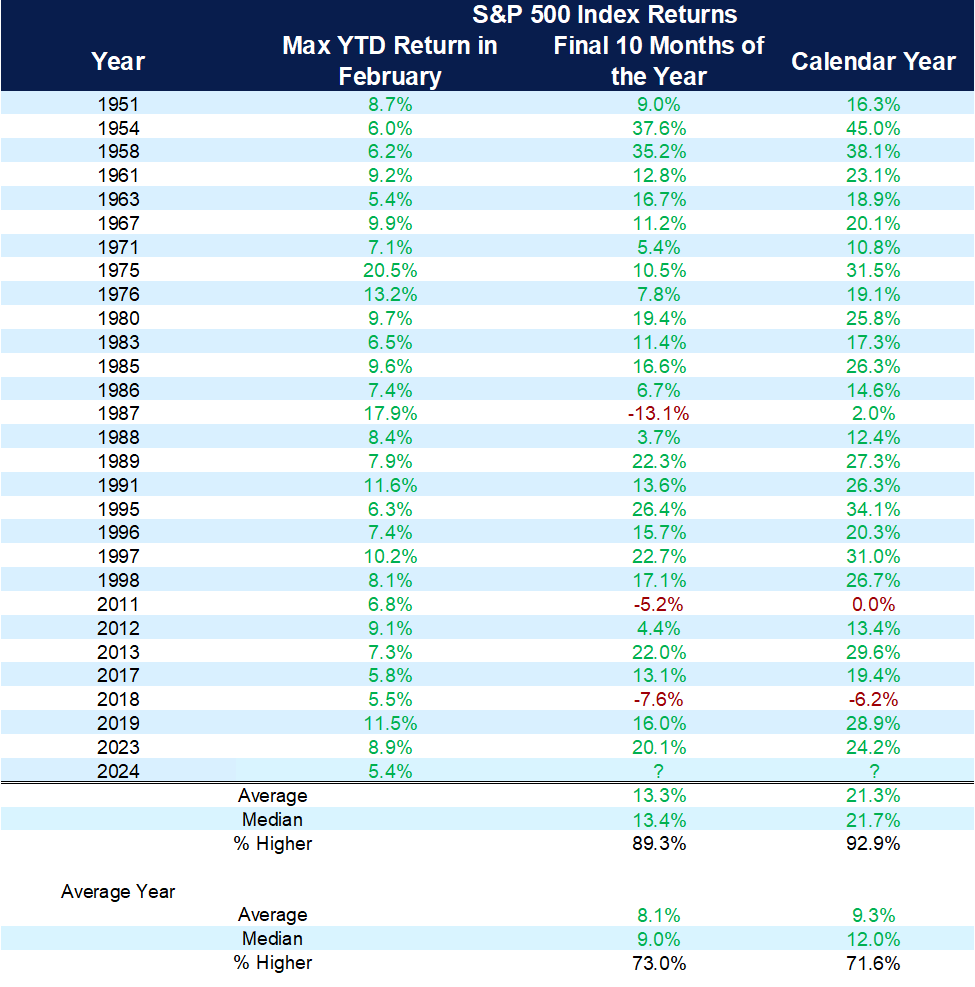
The chart below shows that higher prices may remain likely. When stocks have been up more than 5% in the month of February, the market has been higher more than 70% of the time at year end — for an average gain of over 9%.
A Good Start to 2024 Could Mean the Bull Continues
S&P 500 performance when >5% YTD return in February
Investors are looking for any sign or clarity in a market environment where things may not make sense to everyone. This is a good time to review different market indicators that are worth watching, some just for fun and some that carry much more weight.
1. Super Bowl Indicator: First introduced in 1978, this indicator suggests that a win by a team from the NFC meant the stock market would probably go up that year. For more than 30 years, the indicator had an impressive success rate of 95%. In the years when the AFC team has won, the S&P has earned an average return of 8.2%. When the NFC team has won, the average return has been an impressive 9.7%. Both are favorable sets of returns. More recently, the indicator has had a less-convincing track record, including the last two times the Chiefs have won.
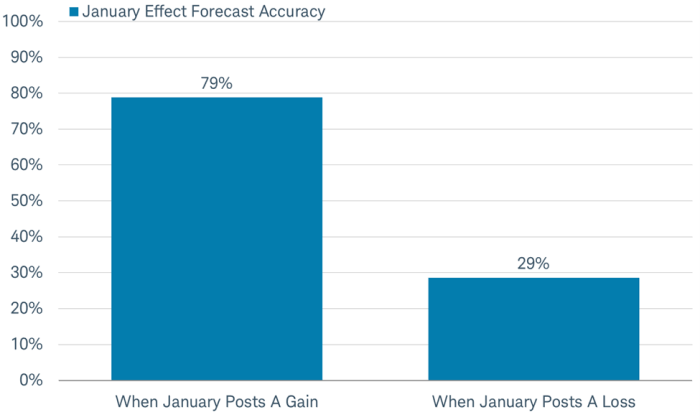
2. The January Barometer: As January goes, so goes the year. As we wrote recently, it is true that January has more consistently indicated the direction of the stock market than any other month. Since 1969, when stocks posted a gain in January, the market ended higher 70% of the time. As a reminder, the market finished higher in January this year.
3. First Five Days: This indicator says that the direction of the market during the first five days of January determines whether the market will be up or down for the whole year. Over the past 44 years, full-year gain followed 19 of the 24 times that the market finished higher. However, the market has posted a gain of more than 70% of the time, no matter what the market did the first five days — and a market decline during the first five days has been a predictor only 25% of the time.
4. Consumer Price Index: This week, the Consumer Price Index for January came in hotter than expected, as CPI rose .3% over December. On an annual basis, CPI was up 3.1%, well above the Fed’s target of 2%. Policymakers are watching closely to ensure it continues to trend to the 2% target, and both the stock and bond market react accordingly. As seen on Tuesday, inflation (as reported by CPI) can affect the market in the short term. Time will tell if Tuesday’s selloff was an overreaction to one inflation report or the start of a trend.
5. Yield Curve: The government bond market tends to signal a global recession when short-term bond yields rise above long-term yields. In 2023, the Group of Seven countries (Canada, France, Germany, Italy, Japan, the United Kingdom and the United States) all had inverted yield curves. Only one country, the United States, has avoided recession and negative GDP growth for one quarter last year. A return to a more normal yield curve may signal a better outlook for these countries. An inverted yield curve has been a strong recessionary indicator in the past. Every recession has been preceded by an inverted yield curve, but not every inverted yield curve has led to a recession.
6. Equal Weighted Index: Most stock market indexes are capital weighted. Market capitalization is stock price times number of shares outstanding. The larger the market capitalization, the larger the weighting for most indexes, and the bigger the impact on market performance. Equal-weighted index has each stock at the same weighting, providing a measure of what the average stock is doing rather than a handful of the largest ones, known as the Magnificent Seven. In general, the greater the number of stocks pushing the market higher, referred to as market breadth, the more support the market has. The last 14+ months have seen very little breadth to the market gains.
No one indicator or past statistical support provides a guarantee of future performance. Sometimes, people look for causation and not correlation. The popularity of certain indicators for investment decisions is a testament to the desire for an easy answer on how to invest in complex markets.
It is important to look at a multitude of economic data as well as leading and lagging indicators and not get pulled into making decisions based on a single month of data — or on a single data point.
The CD Wealth Formula
We help our clients reach and maintain financial stability by following a specific plan, catered to each client.
Our focus remains on long-term investing with a strategic allocation while maintaining a tactical approach. Our decisions to make changes are calculated and well thought out, looking at where we see the economy is heading. We are not guessing or market timing. We are anticipating and moving to those areas of strength in the economy — and in the stock market.
We will continue to focus on the fact that what really matters right now is time in the market, not out of the market. That means staying the course and continuing to invest, even when the markets dip, to take advantage of potential market upturns. We continue to adhere to the tried-and-true disciplines of diversification, periodic rebalancing and looking forward, while not making investment decisions based on where we have been.
It is important to focus on the long-term goal, not on one specific data point or indicator. Long-term fundamentals are what matter. In markets and moments like these, it is essential to stick to the financial plan. Investing is about following a disciplined process over time.
Sources: Carson, Kestra Investment Management, Schwab

This material contains an assessment of the market and economic environment at a specific point in time and is not intended to be a forecast of future events, or a guarantee of future results. Forward-looking statements are subject to certain risks and uncertainties. Actual results, performance, or achievements may differ materially from those expressed or implied. Information is based on data gathered from what we believe are reliable sources.
Using diversification as part of your investment strategy neither assures nor guarantees better performance and cannot protect against loss of principal due to changing market conditions.
Past performance is not a guarantee of future results.
The opinions expressed in this commentary are those of the author and may not necessarily reflect those held by Kestra Investment Services, LLC or Kestra Advisory Services, LLC. This is for general information only and is not intended to provide specific investment advice or recommendations for any individual. It is suggested that you consult your financial professional, attorney, or tax advisor with regard to your individual situation.
Securities offered through Kestra Investment Services, LLC (Kestra IS), member FINRA/SIPC. Investment Advisory Services offered through Kestra Advisory Services, LLC (Kestra AS) an affiliate of Kestra IS. CD Wealth Management and Bluespring Wealth Partners LLC* are affiliates of Kestra IS and Kestra AS. Investor Disclosures: https://bit.ly/KF-Disclosures
*Bluespring Wealth Partners, LLC acquires and supports high quality investment adviser and wealth management companies throughout the United States.
Fidelity Investments and Fidelity Institutional® (together “Fidelity”) is an independent company, unaffiliated with Kestra Financial or CD Wealth Management. Fidelity is a service provider to both. There is no form of legal partnership, agency affiliation, or similar relationship between your financial advisor and Fidelity, nor is such a relationship created or implied by the information herein. Fidelity has not been involved with the preparation of the content supplied by CD Wealth Management and does not guarantee, or assume any responsibility for, its content. Fidelity Investments is a registered service mark of FMR LLC. Fidelity Institutional provides clearing, custody, or other brokerage services through National Financial Services LLC or Fidelity Brokerage Services LLC, Members NYSE, SIPC.


