
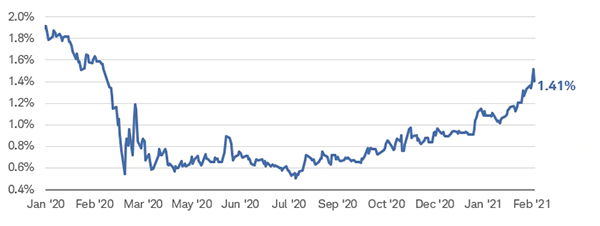
The spike in U.S. Treasury bonds last week sent a small sell-off through the global markets. The 10-year Treasury yields surged to their highest level in more than a year, as seen in the chart below. The bond market is forecasting that higher economic growth is likely to occur this year with the rollout of vaccines and additional fiscal stimulus, and the Federal Reserve has stated on many occasions that it plans to let inflation run above 2% for an extended period of time.
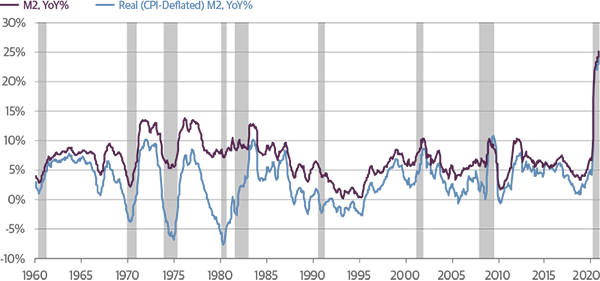
With the likelihood of another stimulus package coming in March, we will be watching the money supply, which historically has been a leading indicator for the economy. The M2 money supply — the amount of currency, deposits and money in checking accounts, plus retail money market fund balances and savings deposits — has grown at a rate of 25% over the past year and is at its highest rate since 1960. COVID relief acts in 2020 explain this rapid growth; as stimulus checks have been mailed to households, checking and savings account balances increased over the last year. Some of the money has been spent and has flowed through the economy, but most has been saved. The unspent money will eventually find its way into the economy and the markets.
In recent weeks, the primary driver of the 10-year Treasury’s surge has been the rising expectation of inflation from this excess money supply. However, it is not a foregone conclusion that long-term rates are on a higher trajectory. As seen in the chart below, recessions like we had in 2020 have typically been followed by low interest rates several quarters later. For example, in 2008, the 10-year Treasury bond was at 2%, and in 2012, as the economy recovered, the rate rose to 4%, only to hit 1.4%.

The Federal Reserve has many tools at its disposal to fight the rise in long-term rates, including the ability to ease investors’ worries about higher rates through communication. The Fed can continue to purchase bonds in the open market or even increase the amount of bonds it is buying to push rates or drive yields lower. It is important to remember that over the long run, higher yields driven by strong economic growth are a positive for the markets.
So, what can we learn from all this? Markets are concerned that the Fed might rush to raise short-term interest rates in the face of stronger inflation data. The recent rise in the 10-year Treasury yields was driven more by prospects for stronger economic growth than inflation. With the real yield still in negative territory (taking inflation into account), there is plenty of room for the 10-year Treasury to return to normal if the economy’s prospects continue to improve as expected.
We use the above insights to help with the strategic and tactical asset allocation based on where we see the portfolio heading over the next five to seven years, with short-term adjustments along the way. We are not trying to time the market, but we will try to take advantage when we see where the stock and bond market heading. Having a well-balanced, diversified, liquid portfolio and a financial plan are keys to successful investing. The best option is to stick with a broadly diversified portfolio that can help you achieve your own specific financial goals – regardless of market volatility. Long-term fundamentals are what matter.

Sources: Guggenheim, Bloomberg, Charles Schwab
_____
This material contains an assessment of the market and economic environment at a specific point in time and is not intended to be a forecast of future events, or a guarantee of future results. Forward-looking statements are subject to certain risks and uncertainties. Actual results, performance, or achievements may differ materially from those expressed or implied. Information is based on data gathered from what we believe are reliable sources.
Using diversification as part of your investment strategy neither assures nor guarantees better performance and cannot protect against loss of principal due to changing market conditions.
Past performance is not a guarantee of future results.
The MSCI Europe Index is a free float-adjusted market capitalization weighted index that is designed to measure the equity market performance of the developed markets in Europe. The MSCI EAFE Index (Europe, Australasia, Far East) is a free float-adjusted market capitalization index that is designed to measure the equity market performance of developed markets, excluding the US & Canada. The MSCI World Index is a free float-adjusted market capitalization weighted index that is designed to measure the equity market performance of developed markets. The MSCI Emerging Markets Index is a free float-adjusted market capitalization index that is designed to measure equity market performance of emerging markets. The MSCI AC (All Country) Asia ex Japan Index is a free float-adjusted market capitalization weighted index that is designed to measure the equity market performance of Asia, excluding Japan. The Dow Jones Industrial Average is a popular indicator of the stock market based on the average closing prices of 30 active U.S. stocks representative of the overall economy.
S&P 500 Index is an unmanaged group of securities considered to be representative of the stock market in general. NASDAQ Composite Index measures all NASDAQ domestic and international based common type stocks listed on The NASDAQ Stock Market. The Russell 2000 Index measures the performance of the small-cap segment of the U.S. equity universe. It is not possible to invest directly in an index.
The opinions expressed in this commentary are those of the author and may not necessarily reflect those held by Kestra Investment Services, LLC or Kestra Advisory Services, LLC. This is for general information only and is not intended to provide specific investment advice or recommendations for any individual. It is suggested that you consult your financial professional, attorney, or tax advisor with regard to your individual situation.
Securities offered through Kestra Investment Services, LLC (Kestra IS), member FINRA/SIPC. Investment Advisory Services offered through Kestra Advisory Services, LLC (Kestra AS) an affiliate of Kestra IS. Kestra IS and Kestra AS are not affiliated with CD Wealth Management.


