
We are excited for 2021, and we think the same positive momentum that helped us finish the year strong will continue in the weeks and months ahead. Among our reasons for optimism:
1. The improved health of the global economy and the successful worldwide rollout of the COVID-19 vaccine.
2. Rapid technological adoption and the ascension of the digital economy, caused by the pandemic.
3. The Federal Reserve’s commitment to an inflation target of 2% and the outlook of low interest rates for several years.
4. The amount of cash on the sidelines that is waiting to be deployed on sizable market retractions.
5. Consumer savings that are significantly elevated, compared to pre-pandemic levels.
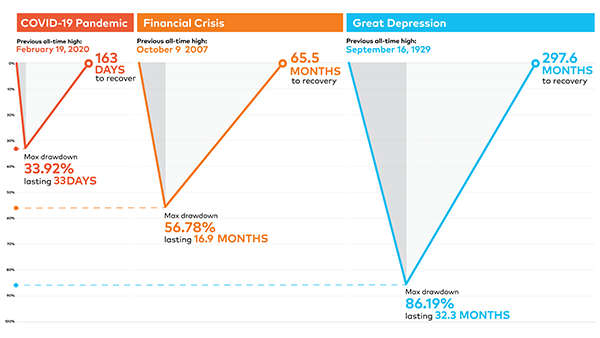
6. The swift market recovery, thanks to the government’s quick actions, compared with previous financial crises (see chart below).
The markets — and the global economy — are not without risks, however. History tells us that the biggest risks in a typical year aren’t usually from out of left field, 2020 notwithstanding. Or as Mark Twain famously said, “It ain’t what you don’t know that gets you into trouble. It’s what you know for sure that just ain’t so.”
If we look to identify the unexpected, we see the following as risks to the global markets in 2021:
1. Problems with the vaccine rollout potentially delaying the economic recovery.
2. Trade tensions with China and other countries as a new administration takes over in the White House.
3. A faster tightening of fiscal or monetary policy than is anticipated.
4. Shock to the interest rate caused by inflation or a surge in bond yields.
5. Overbuying in the stock market and valuations being stretched.
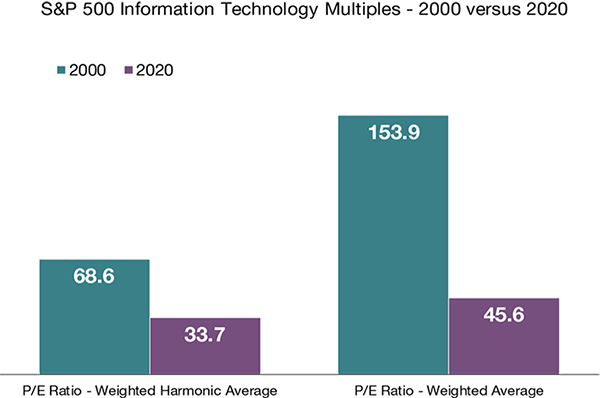
Some have begun to compare 2020 to the tech bubble of 1999-2000, but we believe the two environments are not similar for a number of reasons. The current environment has a more favorable outlook for risk assets, as the 10-year Treasury rate today is less than 1%; in January 2000 it was more than 6.5%. Inflation is low today, and that favors longer-duration assets, such as technology and other innovative companies. Also, the increase in sales of the technology companies is keeping pace with share price increases, while in 2000, share price increases soared well ahead of actual increases in sales.
Most importantly, equity valuations are modestly higher than that of the S&P 500 today, whereas in 2000, technology multiples were more than 2 times the multiple of the S&P 500. The harmonic averages shown in the chart below remove significant outliers — giving a better sense of the value of a company — and the disparity between weighted average and harmonic average points to numerous stocks in 2000 with extreme valuations, compared to today.
The rally in technology stocks today is being driven by stronger earnings and better profitability. Innovation continues to drive the technological revolution, accelerated by the pandemic. There will continue to be winners and losers from this race, as in all races, but we think that pace of technological change will only continue to increase in the future.
So, what can we learn from all this? Whether or not these particular risks occur, a new year almost always brings surprises. From an investment perspective, we use these trends to help with the strategic and tactical asset allocation and to define where we see the portfolio heading over the next five to seven years, with short-term adjustments along the way. We are not trying to time the market, but we will try to take advantage when we see where the market is heading. Having a well-balanced, diversified portfolio and a financial plan are the keys to successful investing. The best option is to stick with a broadly diversified portfolio that can help you achieve your own specific financial goals, regardless of market volatility. Long-term fundamentals are what matter.

Sources: Bloomberg and Capstone Research, Factset
_____
This material contains an assessment of the market and economic environment at a specific point in time and is not intended to be a forecast of future events, or a guarantee of future results. Forward-looking statements are subject to certain risks and uncertainties. Actual results, performance, or achievements may differ materially from those expressed or implied. Information is based on data gathered from what we believe are reliable sources.
S&P 500 Index is an unmanaged group of securities considered to be representative of the stock market in general. The Dow Jones Industrial Average is a popular indicator of the stock market based on the average closing prices of 30 active U.S. stocks representative of the overall economy. NASDAQ Composite Index measures all NASDAQ domestic and international based common type stocks listed on The NASDAQ Stock Market. The Russell 2000 Index (RTY) measures the performance of the small-cap segment of the U.S. equity universe. The MSCI EAFE Index (MXEA) is an equity index which captures large and mid cap representation across 21 Developed Markets countries around the world, excluding the US and Canada. The S&P 500® Value Index (SVX), represents the value companies, as determined by the index sponsor, of the S&P 500 Index. The Index measures the performance of large-capitalization value companies in the United States. The MSCI Emerging Markets Index (MXEF) captures large and mid cap representation across 26 Emerging Markets countries. The NASDAQ-100 Index (NDX) is made up of 103 equity securities issued by 100 of the largest non-financial companies listed on the Nasdaq stock market. It is a modified capitalization-weighted index. The S&P 500® Growth Index (SGX), represents the growth companies, as determined by the index sponsor, of the S&P 500 Index. The Index measures the performance of large-capitalization growth companies in the United States. It is not possible to invest directly in an index.
Using diversification as part of your investment strategy neither assures nor guarantees better performance and cannot protect against loss of principal due to changing market conditions.
The opinions expressed in this commentary are those of the author and may not necessarily reflect those held by Kestra Investment Services, LLC or Kestra Advisory Services, LLC. This is for general information only and is not intended to provide specific investment advice or recommendations for any individual. It is suggested that you consult your financial professional, attorney, or tax advisor with regard to your individual situation.
Securities offered through Kestra Investment Services, LLC (Kestra IS), member FINRA/SIPC. Investment Advisory Services offered through Kestra Advisory Services, LLC (Kestra AS) an affiliate of Kestra IS. Kestra IS and Kestra AS are not affiliated with CD Wealth Management.


