
The stock market is worried that longer-term interest rates will continue their upward trend and that the Federal Reserve may not be able to control it. Technology stocks are in a correction. The NASDAQ is more than 10% down from its recent historic high three weeks ago. Many large-cap technology names, like the fabled FAANG stocks (Facebook, Apple, Amazon, Netflix and Google) are down even more. These same technology stocks led us out of the depths of the pandemic, so some pullback is to be expected.
Why do growth stocks tend to sell off with rising interest rates? The method Wall Street uses to value stocks is to discount future cash flows to what they may be worth in today’s dollars. Stocks are valued based on how much cash they can generate in the future. We then must figure out the present value of the expected future stream of cash flows. No one knows how much cash a company will generate next year or years from now; many factors are involved, such as the economy, company management, competition and the nature of the business. The farther one looks into the future, the harder it is to estimate future cash flows.
After you estimate future cash flows, you need to make a guess on what interest rate should be used to discount those cash flows to today’s dollars. A dollar today won’t be worth a dollar five years from now; it will be worth less. The higher the interest rate you use to discount cash flows, the less a dollar five years from now will be worth today. From a market perspective, as rates rise and a higher interest rate is used to discount future cash flows, the less a company may be worth. This is why the same growth stocks that have performed so well for the last year are now in correction mode: the fear of higher rates and what they may do to future valuations.
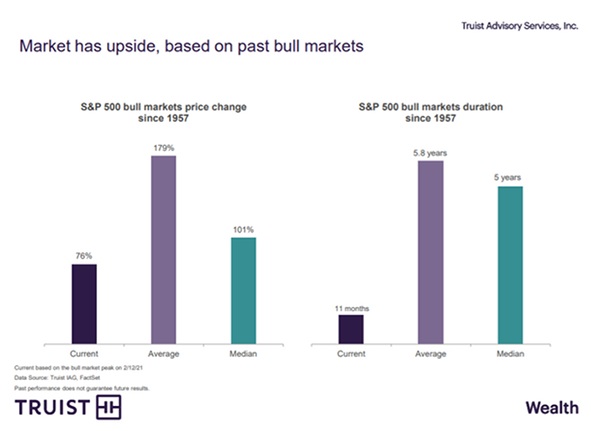
The current bull market for the S&P 500, which started in April 2020, is only 11 months old. As the chart below shows, the average S&P 500 bull market lasts almost six years, with an average gain of 179%. Within every bull market, multiple corrections may occur. According to data from Yardeni Research, there have been 38 declines of at least 10% in the S&P 500 since 1950 — that’s a double-digit decline almost every two years. In the past 11 years, there have been seven double-digit declines and at least eight others ranging from 5.8% to 9.9%. Corrections are a healthy and normal occurrence and not a reason to change direction.
There remains a strong case for continuing to buy the dips and stay the course with equity allocations:
* Washington is moving forward with passing a $1.9 trillion fiscal relief package in March, with stimulus checks being mailed out at the end of the month.
* The Federal Reserve has been strong in its policy stance and will remain patient with regard to short-term interest rates.
* The U.S. economy is reopening, and momentum is very strong.
* Millennials are investing in equities, and the surge in retail brokerage account openings is further evidence of this trend.
* Short-term bond rates will remain close to zero, making stocks more attractive than cash in the bank.
* The chart below looks at the fastest corrections in the NASDAQ and what has historically followed for index returns.
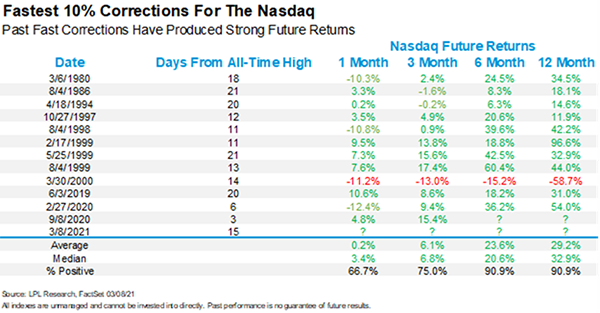
So, what can we learn from all this? Market corrections are a normal occurrence. The key, as we mention on a regular basis, is to stay the course. Selling into a correction may have long-term negative financial consequences for your financial plan.
We use the above insights to help with the strategic and tactical asset allocation based on where we see the portfolio heading over the next five to seven years, with short-term adjustments along the way. We are not trying to time the market, but we will try to take advantage when we see where the stock and bond market heading. Having a well-balanced, diversified, liquid portfolio and a financial plan are keys to successful investing. The best option is to stick with a broadly diversified portfolio that can help you to achieve your own specific financial goals – regardless of market volatility. Long-term fundamentals are what matter.

Sources: Marketwatch, Yardeni, Truist, LPL
_____
This material contains an assessment of the market and economic environment at a specific point in time and is not intended to be a forecast of future events, or a guarantee of future results. Forward-looking statements are subject to certain risks and uncertainties. Actual results, performance, or achievements may differ materially from those expressed or implied. Information is based on data gathered from what we believe are reliable sources.
Using diversification as part of your investment strategy neither assures nor guarantees better performance and cannot protect against loss of principal due to changing market conditions.
Past performance is not a guarantee of future results.
The MSCI Europe Index is a free float-adjusted market capitalization weighted index that is designed to measure the equity market performance of the developed markets in Europe. The MSCI EAFE Index (Europe, Australasia, Far East) is a free float-adjusted market capitalization index that is designed to measure the equity market performance of developed markets, excluding the US & Canada. The MSCI World Index is a free float-adjusted market capitalization weighted index that is designed to measure the equity market performance of developed markets. The MSCI Emerging Markets Index is a free float-adjusted market capitalization index that is designed to measure equity market performance of emerging markets. The MSCI AC (All Country) Asia ex Japan Index is a free float-adjusted market capitalization weighted index that is designed to measure the equity market performance of Asia, excluding Japan. The Dow Jones Industrial Average is a popular indicator of the stock market based on the average closing prices of 30 active U.S. stocks representative of the overall economy.
S&P 500 Index is an unmanaged group of securities considered to be representative of the stock market in general. NASDAQ Composite Index measures all NASDAQ domestic and international based common type stocks listed on The NASDAQ Stock Market. The Russell 2000 Index measures the performance of the small-cap segment of the U.S. equity universe. It is not possible to invest directly in an index.
The opinions expressed in this commentary are those of the author and may not necessarily reflect those held by Kestra Investment Services, LLC or Kestra Advisory Services, LLC. This is for general information only and is not intended to provide specific investment advice or recommendations for any individual. It is suggested that you consult your financial professional, attorney, or tax advisor with regard to your individual situation.
Securities offered through Kestra Investment Services, LLC (Kestra IS), member FINRA/SIPC. Investment Advisory Services offered through Kestra Advisory Services, LLC (Kestra AS) an affiliate of Kestra IS. Kestra IS and Kestra AS are not affiliated with CD Wealth Management.


