
Time slows down for no one. It is hard to believe we are already in the fourth quarter of 2022.
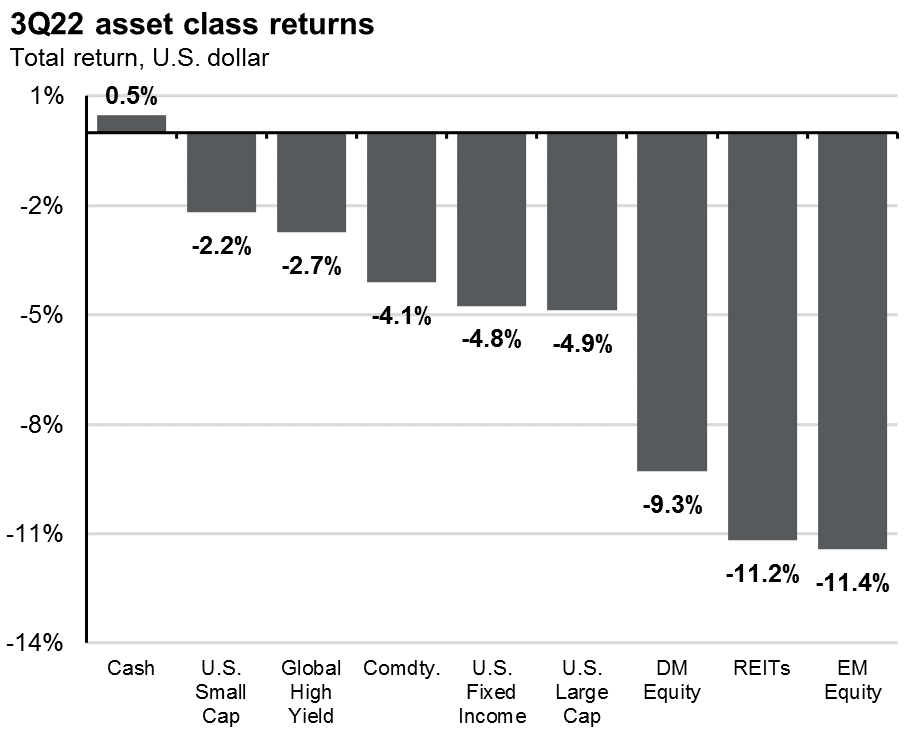
The third quarter of the year saw financial assets continue their decline, as all asset classes — other than cash — delivered negative returns. The Fed’s third consecutive rate hike of 75 basis points (.75%) put further pressure on stocks and bonds. The summer rally we saw in July and early August was erased during the second half of the quarter as inflation continued to rear its ugly head.
The strong correlation of returns between stocks and bonds remained, as bonds were down almost 5% for the quarter. Credit quality in bonds has remained stable this year. However, slower growth, persistent inflation and higher rates could increase credit risk in the coming months. The S&P 500 and NASDAQ both had their worst months since 2008, and the Dow had its worst month since 2002.
International stocks remain challenged by higher energy costs and the ongoing war in Ukraine. Developed markets were down over 9%, and emerging markets were the worst performing in the third quarter, down over 11%. The United Kingdom took strong action last week to step in and purchase bonds to help their markets with additional liquidity.
As we head into the fourth quarter, the main drivers of the market continue to be inflation, China’s path to reopening from the pandemic and war in Ukraine. At the end of the third quarter, we saw a big bounce in short-term interest rates, with the 2-year Treasury trading close to 4.3%. As rates rise, bond prices fall. We are currently seeing high-quality fixed income valuations sitting near 10-year lows.
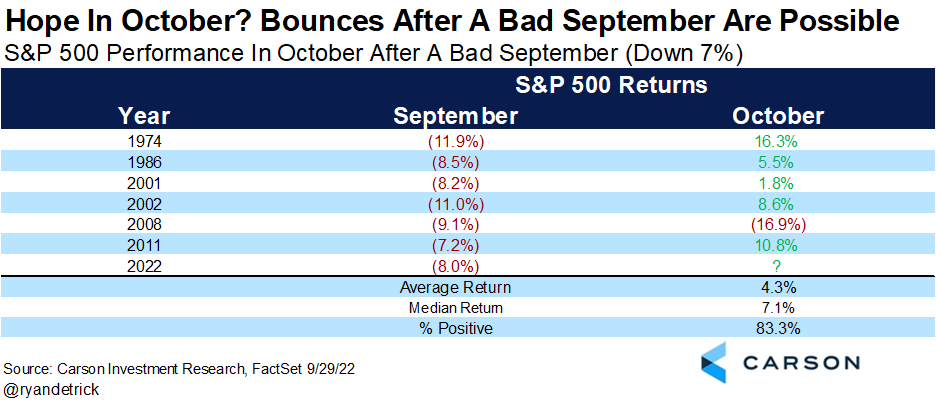
At the same time, S&P 500 forward Price to Earnings (PE) multiples are almost 10% below their long-term averages. These attractive valuations in stocks and bonds historically have led to significant long-term investment opportunities. The chart below shows how the market has responded following a bad month of September — and as we previously wrote, this September was one for the record books. The only instance of a continued slide occurred during the Great Financial Crisis, and we do not believe that this market is similar.
What do we expect for the fourth quarter?
As earnings season starts in a few weeks, most companies are in the process of reducing their earnings forecast based on continued inflationary pressures and higher borrowing costs from rising rates. Only 7% of stocks in the S&P 500 are trading above their 50-day moving average. A month ago, that number was more than 90%. Leading economic indicators continue to show weakness in the global economy, and more economists think a recession may occur in 2023. As we have written many times, the stock market is a leading indicator. By the time the recession arrives, the stock market will be looking ahead and ramping up for the recovery phase.
Here’s what are we watching:
The Federal Reserve: The Fed has forecasted that the Fed Funds rate may move closer to 4.5% by the end of the year. Short-term rates have risen along with the higher Fed Funds Rate. If the Fed indicates it may ease interest rate hikes, we could see a market rally.
International banks: Over the weekend, rumors of potential liquidity issues at Credit Suisse spread through the markets. Questions about risk management and the firm’s ability to compete against larger Wall Street banks sent the stock plunging. Investors fear another “Lehman Brothers moment,” but since the Great Financial Crisis, we have seen a complete overhaul of the banking system to minimize another Lehman scenario.
Market volatility: Market volatility is always unsettling, but historically it is not unusual. We view volatility as an opportunity to purchase more of what you own when we have larger movements in the market.
Midterm elections: As we recently wrote, the S&P 500 has historically outperformed the market in the 12-month period after the election, with an average return of 16.3%. Since 1962, the S&P 500 has not experienced a negative return either six or 12 months following the election. The stock market has historically preferred when one party is in the White House and the other party controls Congress, even if no major legislation is passed.
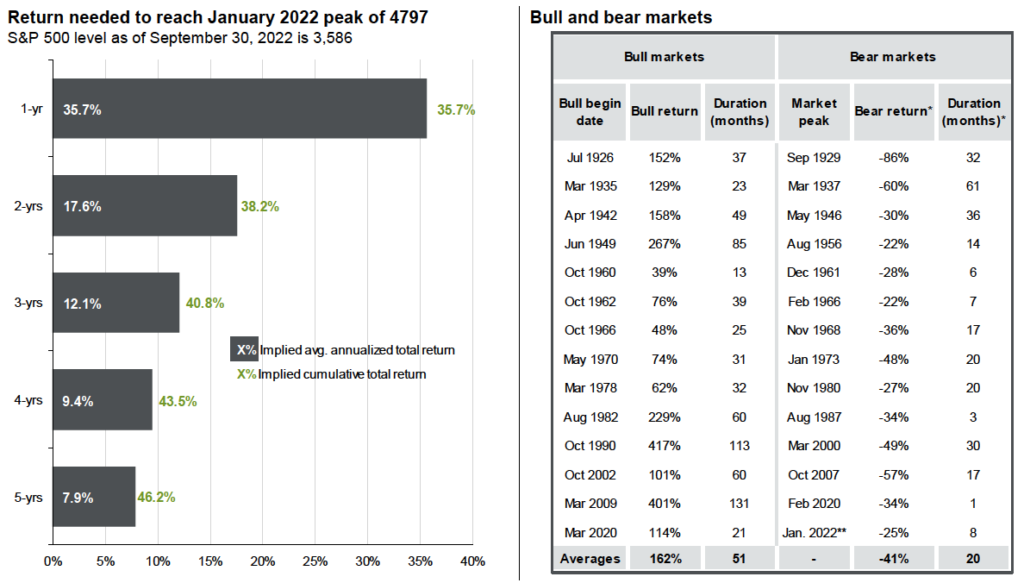
Bear markets do not last forever. We are in a bear market for the Dow, S&P 500 and NASDAQ. Going back to 1929, the average bear market lasts 20 months and has an average loss of 41%, as seen in the chart below on the right. However, the average bull market lasts 51 months and has an average return of 161%. The chart on the left shows how long it may take to get back to the all-time market highs seen in January, depending on the average annual return achieved. Staying invested during these times allows you to participate on the upside when the market recovers – which, historically, it always has.
Equity scenarios: Bull, bear and in between
The CD Wealth Formula
We help our clients reach and maintain financial stability by following a specific plan, catered to each client.
Our focus remains on long-term investing with a strategic allocation while maintaining a tactical approach. Our decisions to make changes are calculated and well thought out, looking at where we see the economy is heading. We are not guessing or market timing. We are anticipating and moving to those areas of strength in the economy — and in the stock market.
We will continue to focus on the fact that what really matters right now is time in the market, not out of the market. That means staying the course and continuing to invest, even when the markets dip, to take advantage of potential market upturns. We continue to adhere to the tried-and-true disciplines of diversification, periodic rebalancing and looking forward, while not making investment decisions based on where we have been.
It is important to focus on the long-term goal, not on one specific data point or indicator. Long-term fundamentals are what matter. In markets and moments like these, it is essential to stick to the financial plan. Investing is about following a disciplined process over time.
Sources: JP Morgan, Carson Investment Research, CNBC, Schwab

This material contains an assessment of the market and economic environment at a specific point in time and is not intended to be a forecast of future events, or a guarantee of future results. Forward-looking statements are subject to certain risks and uncertainties. Actual results, performance, or achievements may differ materially from those expressed or implied. Information is based on data gathered from what we believe are reliable sources.
Using diversification as part of your investment strategy neither assures nor guarantees better performance and cannot protect against loss of principal due to changing market conditions.
Past performance is not a guarantee of future results.
The opinions expressed in this commentary are those of the author and may not necessarily reflect those held by Kestra Investment Services, LLC or Kestra Advisory Services, LLC. This is for general information only and is not intended to provide specific investment advice or recommendations for any individual. It is suggested that you consult your financial professional, attorney, or tax advisor with regard to your individual situation.
Securities offered through Kestra Investment Services, LLC (Kestra IS), member FINRA/SIPC. Investment Advisory Services offered through Kestra Advisory Services, LLC (Kestra AS) an affiliate of Kestra IS. CD Wealth Management and Bluespring Wealth Partners LLC* are affiliates of Kestra IS and Kestra AS. Investor Disclosures: https://bit.ly/KF-Disclosures
*Bluespring Wealth Partners, LLC acquires and supports high quality investment adviser and wealth management companies throughout the United States.


