
September lived up to its reputation as historically being the worst month for stocks. The S&P 500 and NASDAQ suffered their biggest monthly losses of the year last month. The S&P 500 could not avoid its first down quarter in a year.
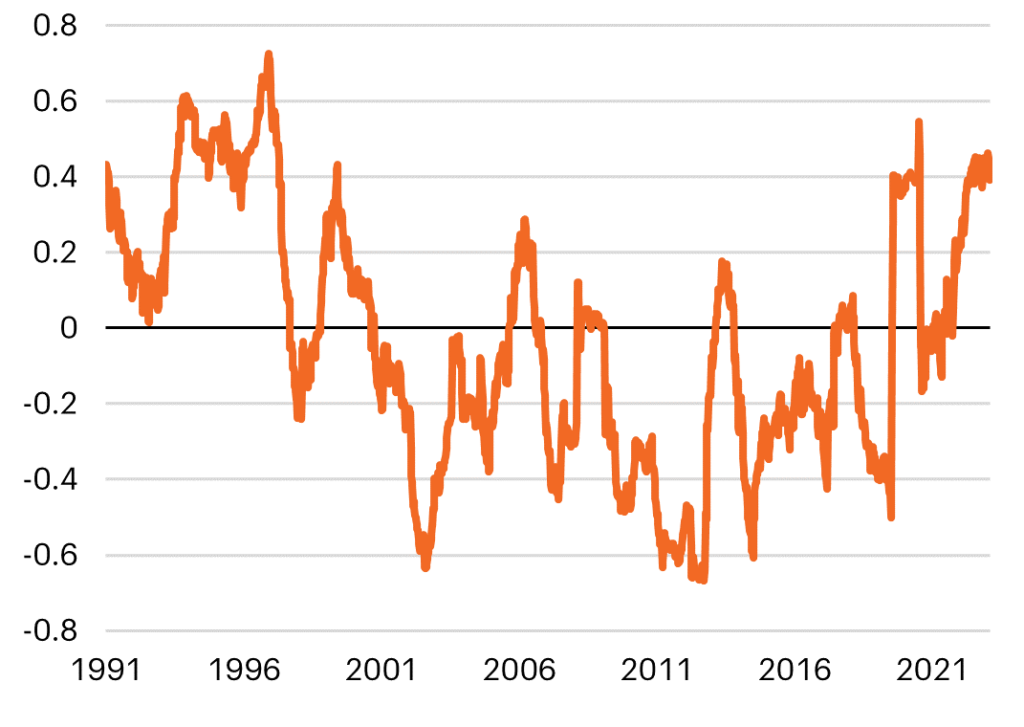
This past quarter was just the fourth in the past 30 years in which stocks and bonds each declined at least 2.5%. (All four of those quarters have been since 2022!) The correlation between stocks and bonds is back near 25-year highs, as seen in the chart below.
What does this mean?
When inflation is higher, stocks and bonds tend to have a positive correlation, i.e., they move in the same direction at the same time, whether that is up or down. Other factors also affect the correlation, but what this means for you is that during times of higher stock and bond correlation, diversification may not be as effective in mitigating downside risk.
52-Week Rolling Stock/Bond Correlation
The U.S. avoided a government shutdown with a last-minute deal this past weekend. However, several headwinds remain before the market moves higher: rising bond yields, oil prices and the strong U.S. dollar.
• The 10-year Treasury hit its highest level since October 2007 this week, breaking above 4.7%. Higher bond yields in September put significant pressure on stocks. Bonds impact stocks in several ways. When bond yields are higher, they compete with stocks for investment dollars because they can be more attractive in the short term. Bonds also figure heavily into the way investors think of valuing stocks, especially for growth-oriented companies. In a higher-yield environment, future projected earnings are worth less to investors today. Therefore, companies that are less profitable or have higher growth get hit harder when rates rise.
• In the third quarter, oil prices rose almost 30% to more than $90 per barrel. The increase in prices over the summer reflects a mismatch between supply and demand. Available supply from major oil exporters, such as Saudi Arabia and Russia, took steps to reduce production, driving prices higher. Consumers in turn are paying more at the pump, which cuts into the money that they have available for discretionary spending on items that are not the staples that they need on an everyday basis.
• After the dollar reached levels not seen in almost 20 years, the dollar had been on a downward trajectory since its peak in 2022. But the dollar now has risen almost 7% since the beginning of July. Historically, a strong dollar has meant weaker earnings and sales for companies that generate a large portion of their revenues from overseas. Converting profits from sales overseas in weaker currencies to the stronger dollar can weigh on revenues and, therefore, earnings.
Reasons for Optimism
On the flip side, the S&P 500 experienced its best seven-month start to the year since 1997. The August and September slump may be setting up stocks for a year-end rally. There are reasons to be optimistic, but during times like this, you must look harder through the forest to find those trees.
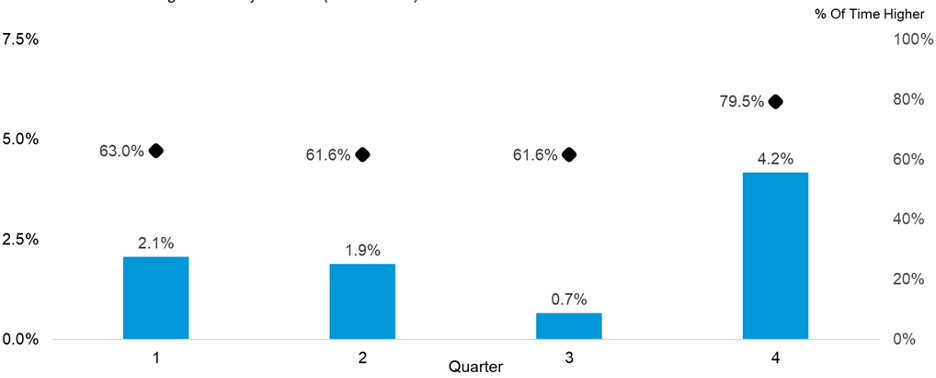
• The fourth quarter is typically the best quarter of the year for stocks. The S&P is up almost 80% of the time and averages a positive return of 4.2%, twice as strong as the next closest quarter. One possible reason is that the third quarter has traditionally been the weakest, and the market maybe rebounding from that.
• The government was able to avoid a shutdown for another 45 days at current funding levels. The legislation buys time for Congress to reach an agreement on spending for the next year. As we have written previously, government shutdowns historically have not caused a major reaction in the markets. Shutdowns can increase volatility, which we have seen over the last few weeks, with the VIX index rising.
• Student loan payments started accruing interest again on Sept. 1, with payments coming due Oct. 1 after a long pause. Loan repayments started to surge this summer; so far, that has not adversely affected consumer spending.
The Fourth Quarter Is Historically the Strongest of the Year
S&P 500 Index quarterly returns (1950-2022)
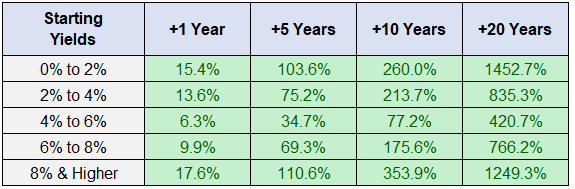
The average 10-year Treasury yield since 1926 is 4.8%, right around the level where we are today. As the chart below illustrates, the best market returns have been in periods of low interest rates, as well as when rates are at their highest levels. This may be because we have not had many times of high inflation, and when those conditions did occur, we saw raging bull markets that followed.
In every instance below, the stock market has produced a positive return when looking at a long-term view in terms of years, not days. We can’t stress enough to you, our clients, that during times of higher volatility and increasing negative sentiment, it is imperative to see the stock market as a long-term investment. Over the long term, it has paid off to stay invested in stocks and ride out the short-term waves.
Starting Interest Rates vs. the Stock Market Since 1926
The CD Wealth Formula
We help our clients reach and maintain financial stability by following a specific plan, catered to each client.
Our focus remains on long-term investing with a strategic allocation while maintaining a tactical approach. Our decisions to make changes are calculated and well thought out, looking at where we see the economy is heading. We are not guessing or market timing. We are anticipating and moving to those areas of strength in the economy — and in the stock market.
We will continue to focus on the fact that what really matters right now is time in the market, not out of the market. That means staying the course and continuing to invest, even when the markets dip, to take advantage of potential market upturns. We continue to adhere to the tried-and-true disciplines of diversification, periodic rebalancing and looking forward, while not making investment decisions based on where we have been.
It is important to focus on the long-term goal, not on one specific data point or indicator. Long-term fundamentals are what matter. In markets and moments like these, it is essential to stick to the financial plan. Investing is about following a disciplined process over time.
Sources: Bloomberg, Carson, Schiller, CNBC, FS Investments

This material contains an assessment of the market and economic environment at a specific point in time and is not intended to be a forecast of future events, or a guarantee of future results. Forward-looking statements are subject to certain risks and uncertainties. Actual results, performance, or achievements may differ materially from those expressed or implied. Information is based on data gathered from what we believe are reliable sources.
Using diversification as part of your investment strategy neither assures nor guarantees better performance and cannot protect against loss of principal due to changing market conditions.
Past performance is not a guarantee of future results.
The opinions expressed in this commentary are those of the author and may not necessarily reflect those held by Kestra Investment Services, LLC or Kestra Advisory Services, LLC. This is for general information only and is not intended to provide specific investment advice or recommendations for any individual. It is suggested that you consult your financial professional, attorney, or tax advisor with regard to your individual situation.
Securities offered through Kestra Investment Services, LLC (Kestra IS), member FINRA/SIPC. Investment Advisory Services offered through Kestra Advisory Services, LLC (Kestra AS) an affiliate of Kestra IS. CD Wealth Management and Bluespring Wealth Partners LLC* are affiliates of Kestra IS and Kestra AS. Investor Disclosures: https://bit.ly/KF-Disclosures
*Bluespring Wealth Partners, LLC acquires and supports high quality investment adviser and wealth management companies throughout the United States.
Fidelity Investments and Fidelity Institutional® (together “Fidelity”) is an independent company, unaffiliated with Kestra Financial or CD Wealth Management. Fidelity is a service provider to both. There is no form of legal partnership, agency affiliation, or similar relationship between your financial advisor and Fidelity, nor is such a relationship created or implied by the information herein. Fidelity has not been involved with the preparation of the content supplied by CD Wealth Management and does not guarantee, or assume any responsibility for, its content. Fidelity Investments is a registered service mark of FMR LLC. Fidelity Institutional provides clearing, custody, or other brokerage services through National Financial Services LLC or Fidelity Brokerage Services LLC, Members NYSE, SIPC.


