
The headlines have been scary recently with escalating tension in the Middle East and higher inflation data causing near-term volatility. Stocks had their worst week of the year and have fallen for three consecutive weeks (for the first time since September).
The S&P 500 gained 27.6% from its low on Oct. 27 through its peak on March 28; this is one of the best five-month rallies in history. Some weakness after that kind of rally is normal. The 5.5% pullback is not so bad in context of a 27.6% rally.
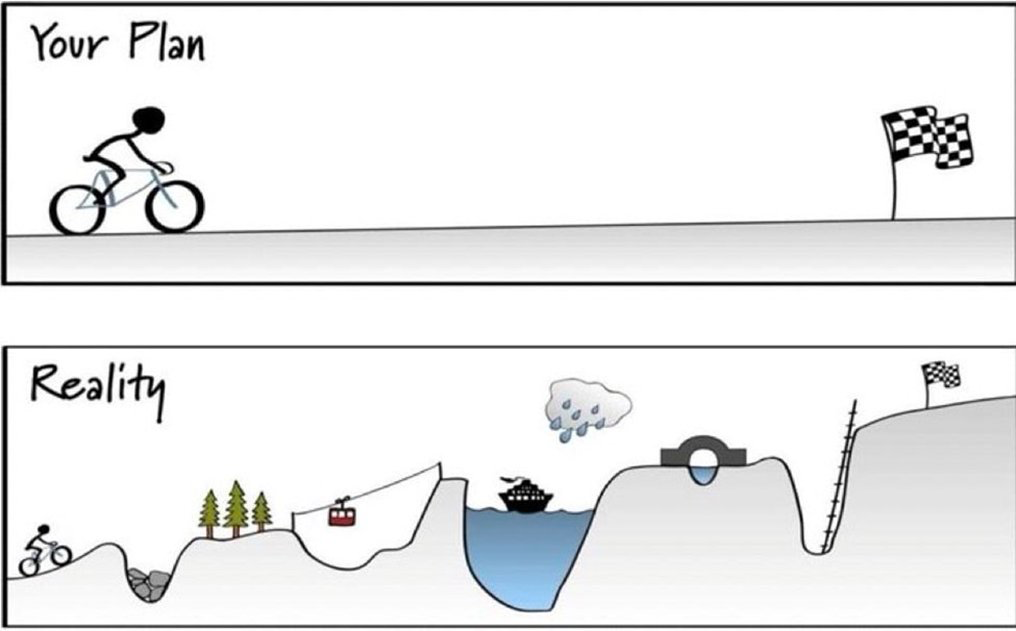
The illustration below is a good reminder that during times of increased market volatility, reality often is different from our preconceived ideas.
This illustration also reflects the last five-plus years. The end of 2018 saw the market fall off a cliff with the market down almost 20% in the fourth quarter alone. The market then had a strong 2019, only to hit a major road bump in 2020 with the pandemic. Then the market quickly climbed out of the hole and continued higher for all of 2021. In 2022, the Fed raised rates to an unprecedented level, and both stocks and bonds sunk to the bottom. In 2023, we saw the markets rise from the bottom and recover the losses incurred during 2022.
So far this year, the momentum has continued, but we inevitably will encounter another speed bump, pothole or cliff — and we will survive that as well if we stay the course.
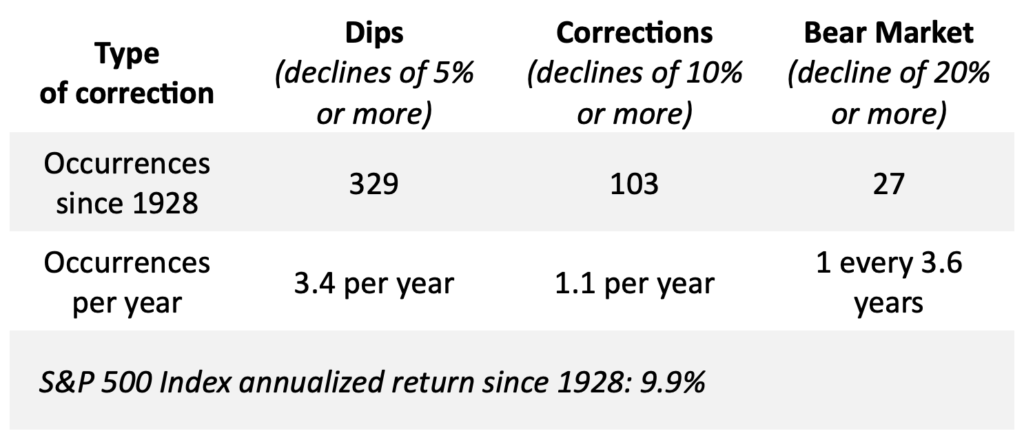
We are now experiencing the first mild correction of the year. Who knows if we will have another pullback or an even larger correction? We do believe that market corrections are inevitable, and they are not predictable. If you plan on investing in the stock market over a long period of time, you will experience many dips, corrections and bear markets.
On average, investors have seen the following since 1928:
• Dips of 5% or more in the market more than three times per year.
• Dips of 10% or more in the market (known as a correction) about once a year.
• Drops of 20% or more (bear markets) once every three or four years and are usually tied to a recession.
Declines in the S&P 500 Index Since 1928
Downturns and market corrections can be difficult to endure, but they also can offer opportunities for investors to purchase stocks at lower prices. Stock prices and valuations swing daily.
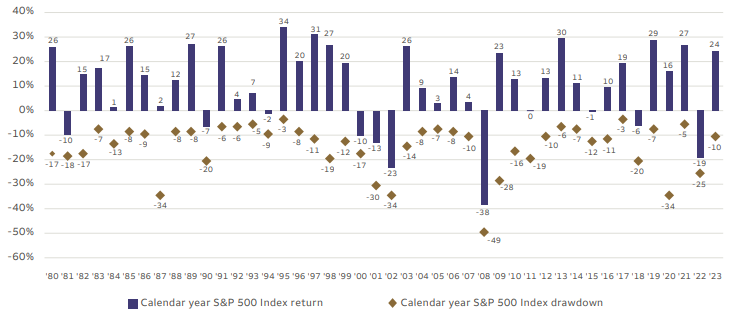
The chart below shows stock returns as well as drawdowns yearly going back to 1980. The blue bar represents the S&P 500 return for the year while the dot shows the percentage decline in the S&P for that same year. Since 1980, stocks have dropped an average of 14% during the calendar year. During the same period, stocks have generally bounced back, rising in 33 of the 43 years. The average return from 1980 to 2023 has been almost 10% per year.
Annual Returns and Drawdowns of the S&P 500 Index
Most investors spend their time worrying about the short term and spend their lives focusing on the day-to-day. As we often preach, investing is about the long term, which requires patience. Markets do not go up in a straight line.
Most investors’ mistakes are the result of being impatient, and successes are a triumph of patience — staying invested through pullbacks, corrections and bear markets.
The CD Wealth Formula
We help our clients reach and maintain financial stability by following a specific plan, catered to each client.
Our focus remains on long-term investing with a strategic allocation while maintaining a tactical approach. Our decisions to make changes are calculated and well thought out, looking at where we see the economy is heading. We are not guessing or market timing. We are anticipating and moving to those areas of strength in the economy — and in the stock market.
We will continue to focus on the fact that what really matters right now is time in the market, not out of the market. That means staying the course and continuing to invest, even when the markets dip, to take advantage of potential market upturns. We continue to adhere to the tried-and-true disciplines of diversification, periodic rebalancing and looking forward, while not making investment decisions based on where we have been.
It is important to focus on the long-term goal, not on one specific data point or indicator. Long-term fundamentals are what matter. In markets and moments like these, it is essential to stick to the financial plan. Investing is about following a disciplined process over time.
Sources: Carson, Wells Fargo

This material contains an assessment of the market and economic environment at a specific point in time and is not intended to be a forecast of future events, or a guarantee of future results. Forward-looking statements are subject to certain risks and uncertainties. Actual results, performance, or achievements may differ materially from those expressed or implied. Information is based on data gathered from what we believe are reliable sources.
Using diversification as part of your investment strategy neither assures nor guarantees better performance and cannot protect against loss of principal due to changing market conditions.
Past performance is not a guarantee of future results.
The opinions expressed in this commentary are those of the author and may not necessarily reflect those held by Kestra Investment Services, LLC or Kestra Advisory Services, LLC. This is for general information only and is not intended to provide specific investment advice or recommendations for any individual. It is suggested that you consult your financial professional, attorney, or tax advisor regarding your individual situation.
Securities offered through Kestra Investment Services, LLC (Kestra IS), member FINRA/SIPC. Investment Advisory Services offered through Kestra Advisory Services, LLC (Kestra AS) an affiliate of Kestra IS. CD Wealth Management and Bluespring Wealth Partners LLC* are affiliates of Kestra IS and Kestra AS.
Investor Disclosures: https://bit.ly/KF-Disclosures


