
September held true to its history of being the worst month for performance on average since the S&P 500’s inception in 1928. The month ended with increased volatility (as measured by the VIX index) and negative market sentiment. Its negative market returns marked the first time in eight months that the S&P 500 ended a month in negative territory. There was no shortage of risks working against the financial markets, including debt ceiling negotiations, fiscal policy uncertainty, monetary policy uncertainty, global supply chain bottlenecks, slowing economic growth projections from the Delta variant and ongoing inflation fears.
How does the VIX index work? Read “Coping with Volatility in the Market.”
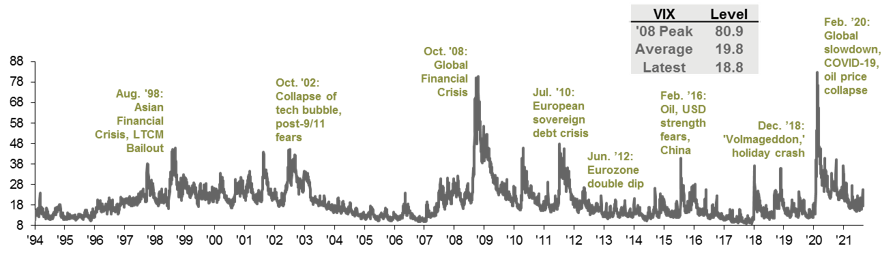
The chart below depicts the VIX index over the last 27 years. Volatility has risen recently, reflecting the possibility of a broader distribution of potential market outcomes based on many of the risks listed above. We are a far cry from volatility levels seen during the financial crisis of 2008 or the global pandemic in 2020, however; the VIX index remains below average heading into the fourth quarter of the year.
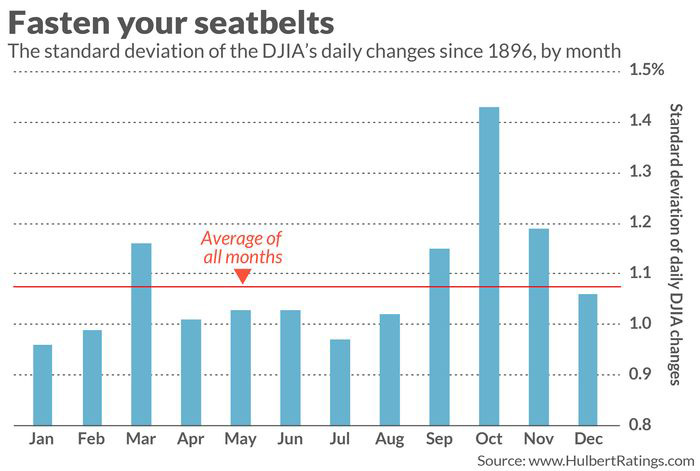
October remains the most volatile month of the calendar, as you can see from the chart below. October’s above-average volatility isn’t a function of any one year or a presidential cycle; it has been consistent over decades and market cycles. As volatility increases, it doesn’t necessarily mean that the market will go down more — but it does mean that the ranges of market movements increase. Often, with increased volatility comes increased emotion accompanying the ups and downs. The feeling of panic when the market is moving down feels greater than the relief or joy feels when the market is moving up.
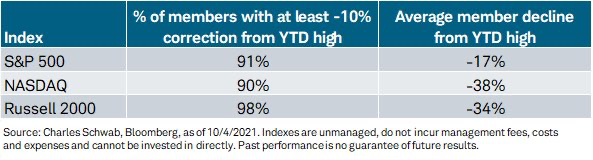
As we wrote last week, more than 90% of the S&P 500 holdings have had at least a 10% correction from their highs this year. The same now holds true for both the NASDAQ and Russell 2000 (small cap stock index). Looking further under the hood of each index below, the average stock decline is far greater than the 10% correction.
So, what can we learn from all this? With many stocks already in correction mode and potential increased volatility on the horizon, it is important to remember that investing is a disciplined process and not a game of timing when to get in or when to get out of the market. “Buy the dip” continues to be a prominent strategy among many investors and one of the reasons market pullbacks have not been as prominent in 2021. The larger dips we have seen recently as volatility has increased have led to some larger declines, followed by stronger bounce backs. As we say each week, it is important to stay the course and focus on the long-term goal — not on one specific data point or indicator.
From a portfolio perspective, we continue to adhere to the tried-and-true disciplines of diversification, periodic rebalancing and looking forward, while not making investment decisions based on where we have been. Making market decisions based on what might happen may be detrimental to long-term performance. The key is to stay invested and stick with the financial plan. Markets go up and down over time, and downturns present opportunities to purchase stocks at a lower value.
It all starts with a solid financial plan for the long run that understands the level of risk that is acceptable for each client. Regarding investments, we believe in diversification and having different asset classes that allow you to stay invested. The best option is to stick with a broadly diversified portfolio that can help you to achieve your own specific financial goals — regardless of market volatility. Long-term fundamentals are what matter.
Sources: JP Morgan, MarketWatch, Schwab

This material contains an assessment of the market and economic environment at a specific point in time and is not intended to be a forecast of future events, or a guarantee of future results. Forward-looking statements are subject to certain risks and uncertainties. Actual results, performance, or achievements may differ materially from those expressed or implied. Information is based on data gathered from what we believe are reliable sources.
Using diversification as part of your investment strategy neither assures nor guarantees better performance and cannot protect against loss of principal due to changing market conditions.
Past performance is not a guarantee of future results.
The opinions expressed in this commentary are those of the author and may not necessarily reflect those held by Kestra Investment Services, LLC or Kestra Advisory Services, LLC. This is for general information only and is not intended to provide specific investment advice or recommendations for any individual. It is suggested that you consult your financial professional, attorney, or tax advisor with regard to your individual situation.
Securities offered through Kestra Investment Services, LLC (Kestra IS), member FINRA/SIPC. Investment Advisory Services offered through Kestra Advisory Services, LLC (Kestra AS) an affiliate of Kestra IS. Kestra IS and Kestra AS are not affiliated with CD Wealth Management. Investor Disclosures: https://bit.ly/KF-Disclosures


