
Reports last week indicated that gross domestic product (GDP) contracted by -0.9% for the second quarter of the year, the second consecutive quarter of negative GDP growth after the first-quarter decline of -1.6%. As a reminder, GDP is the monetary value of all finished goods and services produced within a country’s borders during a specific time period, adjusted for inflation.
Many investors and economists accept that a recession is traditionally defined as two consecutive quarters of GDP decline. However, negative GDP growth alone may be insufficient to describe a recession. Typically, we see rising defaults from companies and individuals as well as higher unemployment during a recession. As we have often written before, the National Bureau of Economic Research — a private research organization and the official arbiter of identifying recessions in the U.S. — describes a recession as “a significant decline in economic activity, spread across the economy, lasting more than a few months.” This definition leaves a lot of room for interpretation.
The following are other observable and measurable economic conditions that could be recession indicators:
• Decline in real GDP: As stated above, we have seen two consecutive quarters of negative GDP growth. Expectations for GDP growth have continued to decrease. Annual GDP growth rates remain positive, but estimates continue to be lowered as the year progresses.
• Decline in real income: Real median household income takes time to calculate due to revisions in inflation data. Data from May shows that personal income increased by .5%, disposable personal income increased by .5% and personal consumption expenditures increased by .2%. However, real disposal personal income decreased by .1%. Why the difference? Inflation. Remember, real income — also known as real wage — is how much money one makes after adjusting for inflation.
• Decline in employment: The unemployment rate has remained steady at 3.6% for five months in a row and arguably represents near full employment for the economy. The low unemployment rate combined with the rise in wages may suggest that consumers are somewhat resilient to a potential recession and economic slowdown.
• Decline in industrial production: The industrial production index measures levels of production and capacity in the manufacturing, mining, electric and gas industries. Industrial production for June declined .2%, and prior months also were revised lower. The average monthly gain so far this year, however, remains positive at .4%. Industrial production increased at an annual rate of 6.1% for the second quarter. In a recession, we typically would see strong negative levels in the industrial production index.
• Decline in wholesale/retail sales: The consumer has remained strong and resilient for the first half of the year. The most recent wholesale report showed an increase of .5% and an increase in 20.9% from the May 2021 level. The most recent retail sales report exceeded expectations and showed an increase of 1% from the previous month and 8.4% above June 2021.
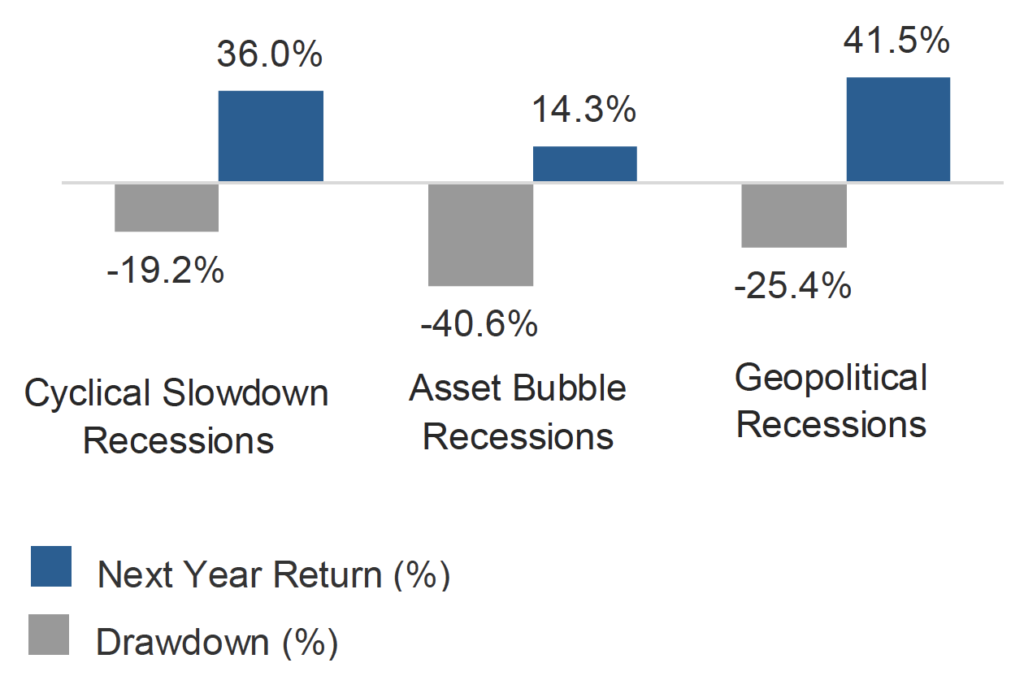
If a recession were to occur, remember that not all recessions are the same. Recessions generally fall into three categories:
• Asset bubble recession: Think of the recession from the technology bubble in 2000 or the great financial crisis of 2008, caused by the housing crisis. This typically leads to a larger financial crisis and results in steep market declines.
• Geopolitically driven recession: These are based on events such as the oil embargo of 1973-1974 or the COVID recession of 2020. They are typically the shortest in duration because they are event-driven.
• Cyclical slowdown recession: This type of recession is usually the least extreme and occurs when there is a shift in supply and demand. As the chart below shows, cyclical slowdown recessions going back to 1947 decline 19.2% on average and have a very strong return the following year.
Average Equity Drawdown and Recovery During Recessions since 1947
While the probability of a recession has increased, recessions in and of themselves are unavoidable. The economic indicators listed above will continue to provide us measurable data about the U.S. economy.
In spite of two consecutive quarters of negative GDP growth, the labor market remains strong, consumers seem resilient today, and output shows that supply-chain issues may be resolving themselves, especially with automobiles. Remember, recessions don’t last forever, and neither do bear markets.
Our focus remains on long-term investing with a strategic allocation while maintaining a tactical approach. Our decisions to make changes are calculated and well thought out, looking at where we see the economy is heading. We are not guessing or market timing. We are anticipating and moving to those areas of strength in the economy and the stock market.
We will continue to focus on the fact that what really matters right now is time in the market, not out of the market. That means staying the course and continuing to invest, even when the markets dip to take advantage of potential market upturns. We continue to adhere to the tried-and-true disciplines of diversification, periodic rebalancing and looking forward, while not making investment decisions based on where we have been.
It is important to focus on the long-term goal, not on one specific data point or indicator. Long-term fundamentals are what matter. In markets and moments like these, it is essential to stick to the financial plan. Investing is about following a disciplined process over time.
Sources: AssetMark, Investopedia, Lord Abbett

This material contains an assessment of the market and economic environment at a specific point in time and is not intended to be a forecast of future events, or a guarantee of future results. Forward-looking statements are subject to certain risks and uncertainties. Actual results, performance, or achievements may differ materially from those expressed or implied. Information is based on data gathered from what we believe are reliable sources.
Using diversification as part of your investment strategy neither assures nor guarantees better performance and cannot protect against loss of principal due to changing market conditions.
Past performance is not a guarantee of future results.
The opinions expressed in this commentary are those of the author and may not necessarily reflect those held by Kestra Investment Services, LLC or Kestra Advisory Services, LLC. This is for general information only and is not intended to provide specific investment advice or recommendations for any individual. It is suggested that you consult your financial professional, attorney, or tax advisor with regard to your individual situation.
Securities offered through Kestra Investment Services, LLC (Kestra IS), member FINRA/SIPC. Investment Advisory Services offered through Kestra Advisory Services, LLC (Kestra AS) an affiliate of Kestra IS. CD Wealth Management and Bluespring Wealth Partners LLC* are affiliates of Kestra IS and Kestra AS. Investor Disclosures: https://bit.ly/KF-Disclosures
*Bluespring Wealth Partners, LLC acquires and supports high quality investment adviser and wealth management companies throughout the United States.


