
The second half of 2023 is fast approaching, and it may hold the potential for fewer surprises now that we have a debt-ceiling deal in place until early 2025. At the same time, global central banks are moving toward a pause in interest-rate hikes, and signs of potential U.S.-China tensions are cooling. That doesn’t mean that the markets don’t have anything to worry about — the ongoing war in Ukraine, stronger inflation than the Fed would like, an expected decline in company earnings, a likely recession in office real estate and potentially residential real estate, and worries that tech stocks, specifically those focused on AI, are in a bubble.
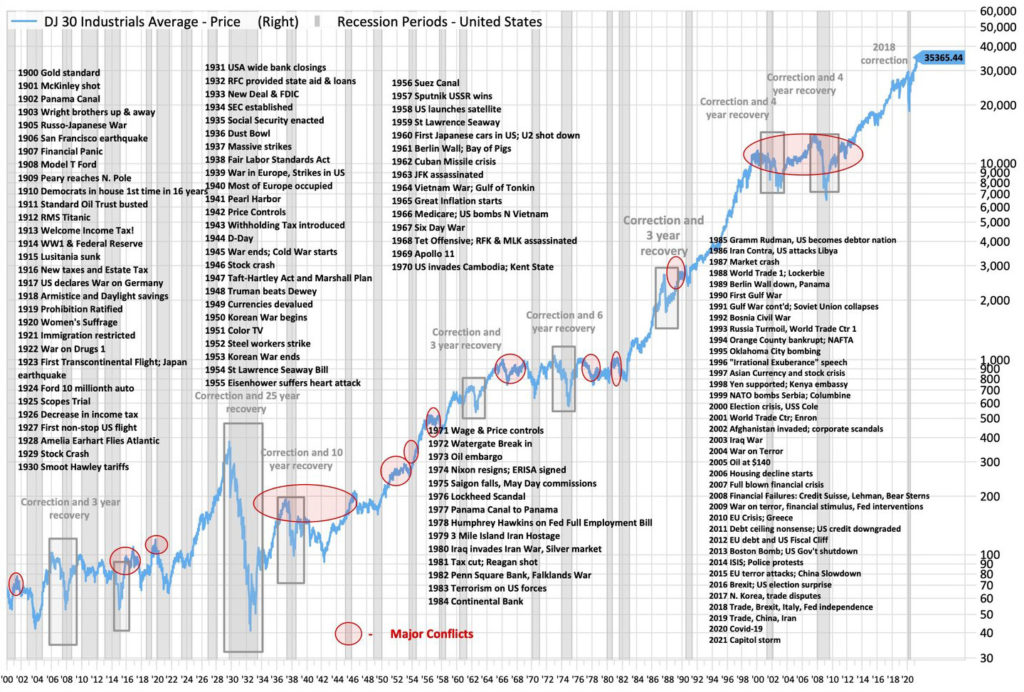
We feel confident that over time, stocks will make new highs yet again, just as they have for the last 100-plus years. The chart below is an interesting reminder that over the last 122 years, the U.S. economy tends to win in the end, despite tough market conditions. The chart measures the Dow over time and considers recessions, market corrections, wars and other news events. The chart’s strong upwards line to the right shows that over the long term, stocks have gone up, despite short-term setbacks and road bumps.
Dow Jones Industrial Average: 122 Years of (Mostly) Bad News
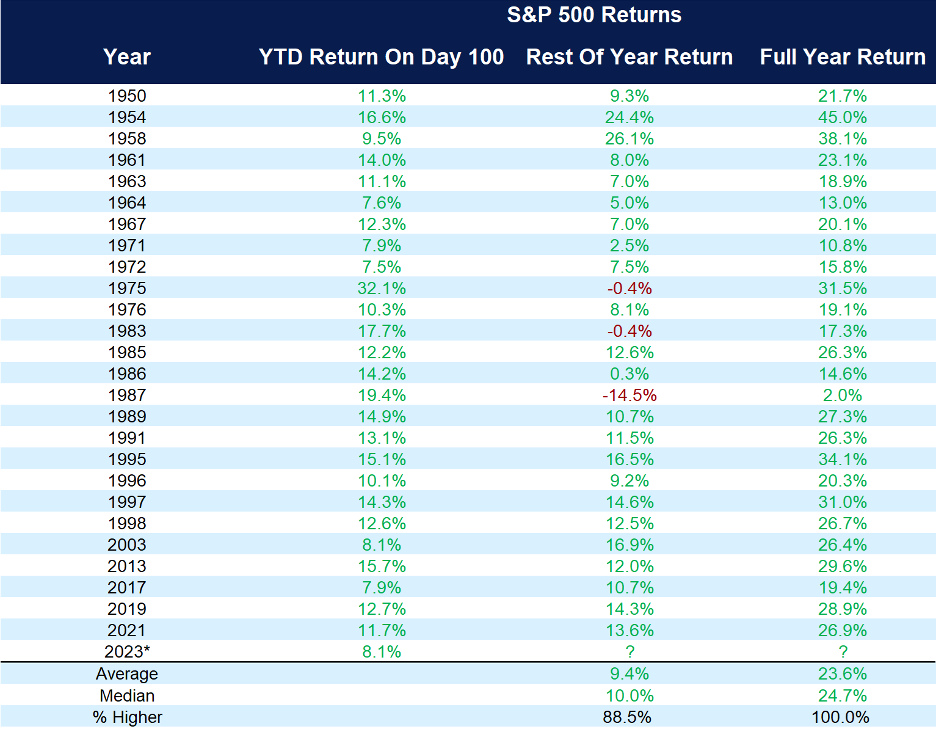
We are now more than 100 trading days into the year. The S&P 500 was up 8.1% through the first 100 days. A good start to the year historically has suggested continued movement higher. When stocks have been up more than 7% during the first 100 days, the rest of the year has been up 89% of the time — and has added another 9.4% on average.
There’s no doubt that a big part of the performance during the first half of the year is attributable to the “Magnificent Seven,” as Jim Cramer has coined them: Apple, Amazon, Google, Meta, Microsoft, Nvidia and Tesla. Through the end of May, the top 10 largest stocks in the S&P 500 had an average return of 9%, while the other 490 stocks in the index returned -4%. (Remember that past performance is no guarantee of future performance.)
Stocks Up Big as of Day 100 Could Mean More Green
S&P 500 YTD >7% on Day 100 and what happened the rest of the year
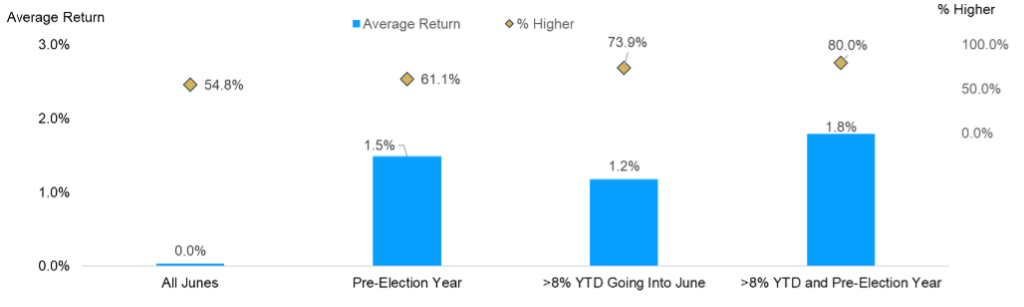
Historically, June can be a weak month for stocks; earnings season is over, and the summer doldrums have begun. The S&P has gained only .03% on average, but as the chart below shows, June gains have been 1.2% on average when stocks are up more than 8% this time of year.
June Isn’t Always Weak for Stocks
S&P 500 performance in June, from 1950-present
While the first half of the year has been a good start for stocks, there are still multiple reasons to look forward to a positive second half of the year — and to avoid the recession talk that seems to have mitigated after strong job numbers last week.
As we head into the second half of the year, we will be watching the impact of higher interest rates on the consumer and real estate, inflation and how the Fed handles interest rates, and the reopening of China’s economy. The economy has not fully felt the impact of last year’s interest rate hikes and the possibility remains for an additional rate hike or two this summer.
The CD Wealth Formula
We help our clients reach and maintain financial stability by following a specific plan, catered to each client.
Our focus remains on long-term investing with a strategic allocation while maintaining a tactical approach. Our decisions to make changes are calculated and well thought out, looking at where we see the economy is heading. We are not guessing or market timing. We are anticipating and moving to those areas of strength in the economy — and in the stock market.
We will continue to focus on the fact that what really matters right now is time in the market, not out of the market. That means staying the course and continuing to invest, even when the markets dip, to take advantage of potential market upturns. We continue to adhere to the tried-and-true disciplines of diversification, periodic rebalancing and looking forward, while not making investment decisions based on where we have been.
It is important to focus on the long-term goal, not on one specific data point or indicator. Long-term fundamentals are what matter. In markets and moments like these, it is essential to stick to the financial plan. Investing is about following a disciplined process over time.
Sources: Brouwer & Janachowski, Carson, Fidelity, Schwab

This material contains an assessment of the market and economic environment at a specific point in time and is not intended to be a forecast of future events, or a guarantee of future results. Forward-looking statements are subject to certain risks and uncertainties. Actual results, performance, or achievements may differ materially from those expressed or implied. Information is based on data gathered from what we believe are reliable sources.
Using diversification as part of your investment strategy neither assures nor guarantees better performance and cannot protect against loss of principal due to changing market conditions.
Past performance is not a guarantee of future results.
The opinions expressed in this commentary are those of the author and may not necessarily reflect those held by Kestra Investment Services, LLC or Kestra Advisory Services, LLC. This is for general information only and is not intended to provide specific investment advice or recommendations for any individual. It is suggested that you consult your financial professional, attorney, or tax advisor with regard to your individual situation.
Securities offered through Kestra Investment Services, LLC (Kestra IS), member FINRA/SIPC. Investment Advisory Services offered through Kestra Advisory Services, LLC (Kestra AS) an affiliate of Kestra IS. CD Wealth Management and Bluespring Wealth Partners LLC* are affiliates of Kestra IS and Kestra AS. Investor Disclosures: https://bit.ly/KF-Disclosures
*Bluespring Wealth Partners, LLC acquires and supports high quality investment adviser and wealth management companies throughout the United States.
Fidelity Investments and Fidelity Institutional® (together “Fidelity”) is an independent company, unaffiliated with Kestra Financial or CD Wealth Management. Fidelity is a service provider to both. There is no form of legal partnership, agency affiliation, or similar relationship between your financial advisor and Fidelity, nor is such a relationship created or implied by the information herein. Fidelity has not been involved with the preparation of the content supplied by CD Wealth Management and does not guarantee, or assume any responsibility for, its content. Fidelity Investments is a registered service mark of FMR LLC. Fidelity Institutional provides clearing, custody, or other brokerage services through National Financial Services LLC or Fidelity Brokerage Services LLC, Members NYSE, SIPC.


