Twenty-five years ago, the dot-com bubble burst, and the NASDAQ reached its peak. Today, we hear the question often in the news: Did AI stocks hit the wall in the first quarter?
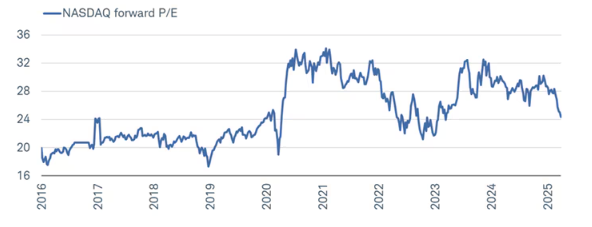
Heading into the year, the Magnificent Seven stocks — Apple, Amazon, Google, Meta, Microsoft, Nvidia and Tesla — led the market after carrying much of the heavy lifting over the past two years. Extended valuations in those stocks made them vulnerable to bad news, and they were down about 16% in the first quarter, trailing the broader S&P 500 index. In turn, valuations for NASDAQ stocks have fallen back to levels last seen in early 2023.
Tech and Tech-Adjacent Under Pressure
Sources: Charles Schwab, Bloomberg. As of 3/28/25. Past performance is no guarantee of future results.
Investors saw that market diversification was the winner for the first quarter, something we haven’t seen in over three years. In 2022, cash was the only asset class that wasn’t negative, with both stocks and bonds falling more than 15%.
While the average 60/40 portfolio (60% stocks, 40% bonds) was negative for the first quarter, it was down much less than the overall market, thanks to diversification. International stocks, as measured by the MSCI ex-US, were up more than 6% — compared to the S&P 500 being down about 5%. (This was an outperformance by almost 11% for international stocks.)
At the same time, bonds (or fixed income) were positive at almost 3%. The leading sectors in the S&P 500 were healthcare, energy and utilities — not technology.
We believe stocks will remain volatile for the near term, driven mainly by tariffs and uncertainty about policy.
Tariffs are not new, but what is different today is their scale. President Trump is targeting more countries, more aggressively, than he did in his first term.
The U.S. announced permanent 25% tariffs on imported cars and certain auto parts. It is important to remember, however, that this policy can shift rapidly, making the idea of timing the market based on tariff news extremely difficult. Global investors should have some clarity this week, after “Liberation Day” tariff announcements on Wednesday.
The five main goals for Trump’s tariffs are curbing the flow of illegal immigration into the U.S., reducing the flow of fentanyl, leveling the playing field with trading partners, boosting government revenue and boosting domestic manufacturing. Trade policy is evolving, with an emphasis on renegotiated deals to strengthen the supply chain and support American industry.
For decades, the U.S. focused on free trade with its political allies and on allowing consumers access to cheaper goods. This has led to a widening trade deficit, less control over supply chains and declining manufacturing at home.
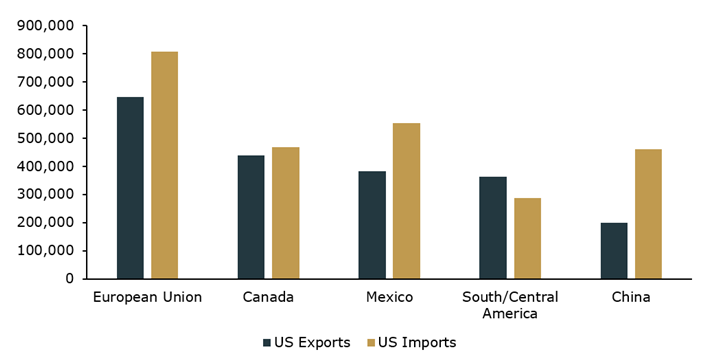
Today the top U.S. exports are energy and autos, while the top imports are autos, auto parts, energy, and electronics. The countries we import from the most to are also the ones that we export to the most, with the notable exception of China, as seen in the chart below.
Imports and Exports by Largest U.S. Trading Partners
Source: Kestra Investment Management with data from the Office of Trade & Economic Analysis, Industry & Analysis, International Trade Administration of U.S. Department of Commerce, and U.S. Census Bureau. Data as of February 2025 with 2024 annual data.
Why does this matter?
After decades of prioritizing free trade, U.S. policymakers are focused on strengthening domestic industries and reducing reliance on imports. Tariffs and reworked trade deals are focused on bringing benefits back to the U.S. This is not something that will play out overnight; these moves will take years to implement.
The pandemic highlighted supply-chain disruptions and the vulnerabilities of relying on imports and products that are manufactured overseas. While many corporations have already been shifting manufacturing away from China and other foreign countries, it takes time and money to bring this back home.
This will come at a price for consumers and corporations. Time will tell how this plays out, and we are more than likely to face many more changes to economic policy.
The CD Wealth Formula
We help our clients reach and maintain financial stability by following a specific plan, catered to each client.
Our focus remains on long-term investing with a strategic allocation while maintaining a tactical approach. Our decisions to make changes are calculated and well thought out, looking at where we see the economy is heading. We are not guessing or market timing. We are anticipating and moving to those areas of strength in the economy — and in the stock market.
We will continue to focus on the fact that what really matters right now is time in the market, not out of the market. That means staying the course and continuing to invest, even when the markets dip, to take advantage of potential market upturns. We continue to adhere to the tried-and-true disciplines of diversification, periodic rebalancing and looking forward, while not making investment decisions based on where we have been.
It is important to focus on the long-term goal, not on one specific data point or indicator. Long-term fundamentals are what matter. In markets and moments like these, it is essential to stick to the financial plan. Investing is about following a disciplined process over time.
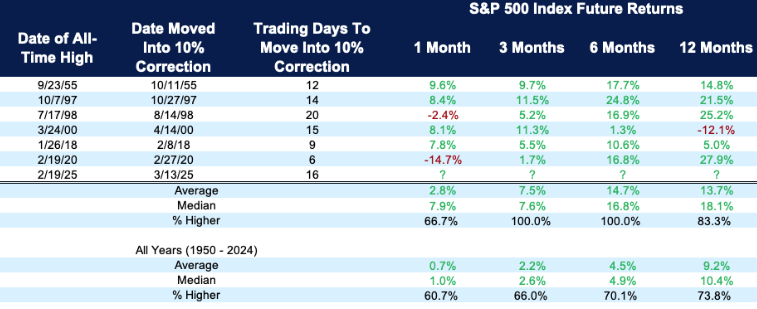
The S&P 500 finished in the positive last week for the first time in more than a month. It wasn’t that long ago that the S&P was down more than 10% on the year and stocks were in correction mode. It took only 16 days for stocks to fall more than 10%, and since that time, stocks have rebounded just as quickly.
Fast bouncebacks are common after fast corrections. As the chart shows, the market has been positive three, six and 12 months after other fast drawdowns in stocks, with an average return of more than 13%. This doesn’t mean that our recent volatility is done or that we won’t revisit the March lows — but it does reiterate our constant drumbeat to ignore the noise and not to time the market because historically, the market has always rebounded.
One of the Fastest Corrections Ever; Now What?
S&P 500 returns after quickest moves into a correction (from all-time high to 10% off peak)
The April 15 tax deadline is approaching fast. Staying informed about policy changes and regularly assessing your financial situation can help you build strategies that align with your goals.
To help you with tax preparation — whether you are doing it yourself or having a CPA help you — here’s a list of the most common documents you will need to gather:
• W-2s: If you work for an employer, you will receive this form, which shows how much you earned and how much was deducted for taxes and other withholdings.
• 1099-NEC (MISC): If you are a contract employee, you can expect to receive this form.
• 1099-INT and 1099-DIV: If you earned interest from savings or investments, you may receive this form. The 1099-DIV reports dividends and distributions from investments.
• Consolidated 1099: This brokerage tax form will show income from dividends, both qualified and non-qualified, as well as any capital gains and losses that occurred during the year.
• 1099-R: If you take a distribution from your retirement account, you will receive this form, which shows the amount of distribution and the amount of taxes withheld.
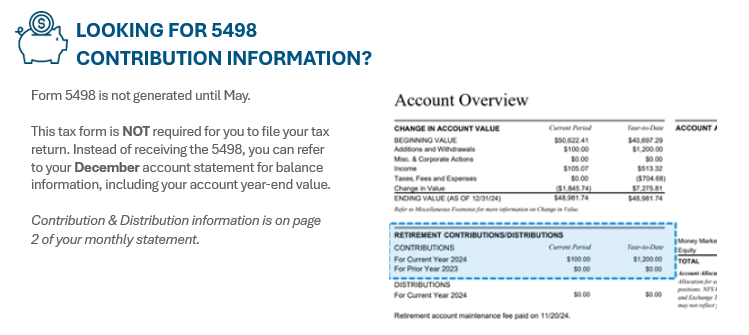
• Form 5498: This form reports your total annual contributions to an IRA account and identifies the type of retirement account you have. Here is some new information about this form for 2024 tax reporting: — In an effort to be more environmentally conscious and efficient, NFS is sending the Form 5498 tax document only if you’ve made contributions, completed rollovers, reached age 72, or have certain types of investments within your brokerage IRA. — From now on, the Form 5498 will also be generated in May. This document is not technically needed for filing and provides a clean summary of your IRA activity, which can be useful for future planning or if you ever need to verify past transactions. — In lieu of this form, you will still need to know how to obtain your contribution and distribution information for your taxes.
• 1098: Those who own a home and pay mortgage interest will receive this form from their lender. It shows the amount of deductible interest a homeowner paid.
• 1098-T: If you have a dependent in college, you will receive this form that reports how much qualified tuition and expense was paid during the year.
• K-1s: If you have any limited partner investments, you will receive this form, which shows each partner’s share of the earnings, losses, deductions and credits.
No one wants to pay more than taxes than they must. The tax code has been simplified over the years, yet it remains incredibly complex.
The number of tax brackets has been reduced significantly, and knowing what marginal tax bracket you are in is very important. If you know your estimated tax rate, that may help determine the most tax-efficient investments.
For example, if you are in a high tax bracket, owning municipal bonds may make sense to reduce your taxable income. If you are in a low tax bracket, you may be able to take advantage of lower capital gains rates and pay less on investments sold for a gain. As always, we recommend speaking with your CPA/Accountant to review.
By first understanding the tax bracket, we can plan better tax strategies for you and your family.
If you’re in a higher tax bracket, the following strategies may make sense:
• If you’re older than 70, consider reducing taxable income by using IRA monies to make charitable distributions. • Consider delaying taking Social Security income until you turn 70. • Take advantage of itemizing by lumping charitable contributions together in one year.
If you’re in a lower tax bracket, the following strategies may make sense:
• Consider increasing withdrawals from IRAs up to the level of the current tax bracket. • You may wish to convert an IRA to a Roth IRA in a year of lower income taxes. • If possible, defer income and sale of capital gain property to postpone taxable income. • If you’re itemizing on your tax return, bunch your medical expenses in the current year to meet the percentage of your adjusted gross income to claim those deductions.
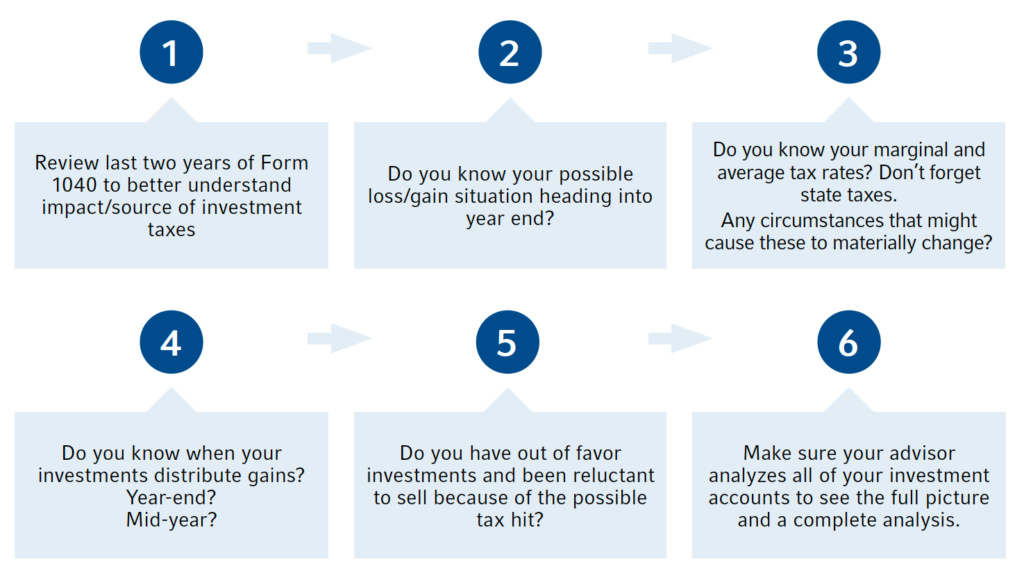
Tax planning is not just a once-a-year event. The chart below is a good reminder that as part of the financial planning process, we are constantly evaluating current circumstances to guide our clients with potential tax saving strategies.
Along with your CPA, we want to ensure we are evaluating the current landscape for tax changes and strategies that may help save future dollars and keep money in your pocket.
Here are some steps to consider before the end of the year:
So, what can we learn from all this? As you prepare to file your taxes before April 15, it is a perfect time to review your financial planning needs. This includes reviewing the investment portfolio, assessing ongoing tax planning opportunities, reviewing retirement goals, and managing your wealth transfer and legacy plans.
The checklist above contains just some of the items that may apply to your family. We are happy to meet to discuss any of the above to make sure you remain on track with your financial profile.
The CD Wealth Formula
We help our clients reach and maintain financial stability by following a specific plan, catered to each client.
Our focus remains on long-term investing with a strategic allocation while maintaining a tactical approach. Our decisions to make changes are calculated and well thought out, looking at where we see the economy is heading. We are not guessing or market timing. We are anticipating and moving to those areas of strength in the economy — and in the stock market.
We will continue to focus on the fact that what really matters right now is time in the market, not out of the market. That means staying the course and continuing to invest, even when the markets dip, to take advantage of potential market upturns. We continue to adhere to the tried-and-true disciplines of diversification, periodic rebalancing and looking forward, while not making investment decisions based on where we have been.
It is important to focus on the long-term goal, not on one specific data point or indicator. Long-term fundamentals are what matter. In markets and moments like these, it is essential to stick to the financial plan. Investing is about following a disciplined process over time.
Stocks slipped into correction mode last week, with the S&P 500 falling more than 10% from its peak in mid-February. It took only 16 trading sessions for the S&P to sink 10%, marking the seventh-fastest correction since 1929. Three of the fastest seven drawdowns have happened under President Trump: 2018, 2020 and now.
Some important things to know about corrections:
• The S&P has averaged 1.1 corrections per year since 1928. • Corrections happen for a reason, and stocks have always fully recovered. • Emotions run high during corrections, and many investors are prone to making costly investment mistakes out of fear that the correction will worsen and stocks won’t bounce back. • The best defense against corrections is to remember that they are normal, even in good stock markets.
S&P 500 Enters Correction Territory
The gauge fell 1.4% Thursday, bringing its three-week rout past 10%
Source: Bloomberg
Corrections feel different every time, and they never feel normal – but they are. We are in a trade war with uncertainty all around us, and markets do not like uncertainty.
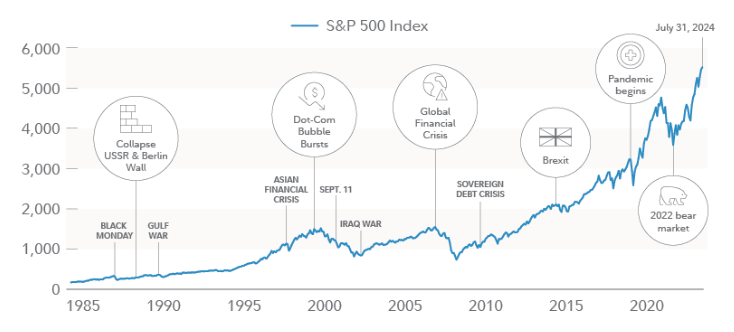
Investors tend to rationalize in a negative context, thinking that the current situation is different from previous corrections. It’s natural to fear the worst. The chart below is a great reminder that throughout history, the U.S. economy and stock market have faced many obstacles and still have gone on to thrive.
Past performance is no guarantee of future results. Sources: FMRCo, Bloomberg, Haver Analytics, FactSet. Data as of July 31, 2024. The S&P 500 Index is a market capitalization-weighted index of 500 common stocks chosen for market size, liquidity, and industry group representation. S&P and S&P 500 are registered service marks of Standard & Poor’s Financial Services LLC. The CBOE Dow Jones Volatility Index is a key measure of market expectations of near-term volatility conveyed by S&P 500 stock index option prices. You cannot invest directly in an index.
Since 1980, the S&P 500 has dropped 5% or more in nearly every year (93% of the time) and 10% or more in almost half of the years (47%). The current correction is the 24th in 46 years, meaning a 10% drop happens more often than not.
Despite that, most years still end positively. Only nine out of those 46 years ended with losses. In 16 of the 24 correction years, the market avoided a bear market (a 20% drop) and still delivered an average return of 9.5%, which matches the long-term average since 1950. Since World War II, there have been 48 corrections, but only 12 turned into bear markets — a relatively low number.
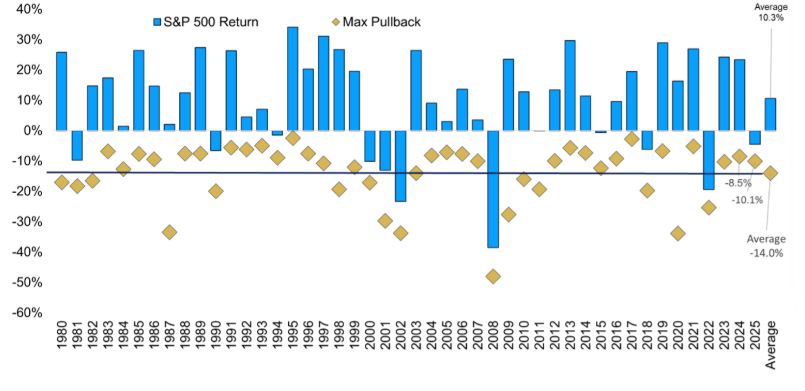
Putting 2025 in Perspective
S&P 500 Index max pullback per calendar year
Sources: Carson, YCharts 3/13/2025 (1980-current)
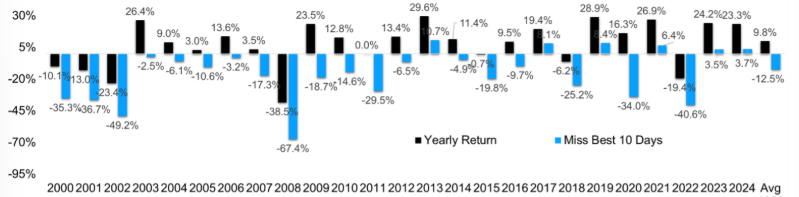
The chart below reminds us that what matters most is time in the market — and not time out of the market. The best and worst days of the year often are close to each other, so if you sell on the bigger down days, you will be more likely to miss the bigger up days to help you recover. We saw this last week; Monday was the worst day of the year, and Friday was the best day of the year.
In 2024, the S&P was up more than 23% on the year. If you missed the best 10 days, your return was less than 4%! (The same was true for 2023.) Since 2000, the average return for the S&P has been 9.5%, but if you were to miss the best 10 days, the return would be -12.5%!
Missing the Best 10 Days of the Year Can Crush Returns
We know that this correction and recent market volatility don’t feel good. Understanding the market’s history is important when you are making decisions about how to achieve your long-term investing goals.
While we don’t know how long the market pullback may last — whether it is short-lived or the start of a longer market drawdown — history shows that the stock market recovers, and diversified investment portfolios help withstand volatility and tough market times.
The CD Wealth Formula
We help our clients reach and maintain financial stability by following a specific plan, catered to each client.
Our focus remains on long-term investing with a strategic allocation while maintaining a tactical approach. Our decisions to make changes are calculated and well thought out, looking at where we see the economy is heading. We are not guessing or market timing. We are anticipating and moving to those areas of strength in the economy — and in the stock market.
We will continue to focus on the fact that what really matters right now is time in the market, not out of the market. That means staying the course and continuing to invest, even when the markets dip, to take advantage of potential market upturns. We continue to adhere to the tried-and-true disciplines of diversification, periodic rebalancing and looking forward, while not making investment decisions based on where we have been.
It is important to focus on the long-term goal, not on one specific data point or indicator. Long-term fundamentals are what matter. In markets and moments like these, it is essential to stick to the financial plan. Investing is about following a disciplined process over time.
Tariffs, tariffs, and more tariffs: A new round of tariffs targeting Canada, Mexico and China has whipsawed the stock market in recent days and weeks. The market does not like uncertainty, and that is exactly what we have right now – daily uncertainty regarding the number of tariffs, as well as what countries and which products will have them.
So, what are tariffs?
Tariffs are taxes on imported goods, intended to get a nation’s consumers to buy local products to boost their country’s economy. A company that imports goods pays the tariff — which can be fixed or variable — to the government. The company then has the choice to pass the cost of the tariff to the end consumer or to eat the cost of the tariff and reduce its corporate profits.
The purpose of tariffs is typically to retaliate against other countries for perceived unfair trade practices. At the end of the day, tariffs can increase the cost of production and the cost to the consumer. They also can harm trade and affect a country’s competitiveness in the marketplace.
Last week alone, 25% tariffs on Mexico and Canada went into effect after a monthlong delay. Then, a day later, a month pause was granted for automakers that comply with the United States-Mexico-Canada Agreement (USMCA), a modernized version of NAFTA. Then on Thursday, the pause was extended to include goods that are compliant with the USMCA.
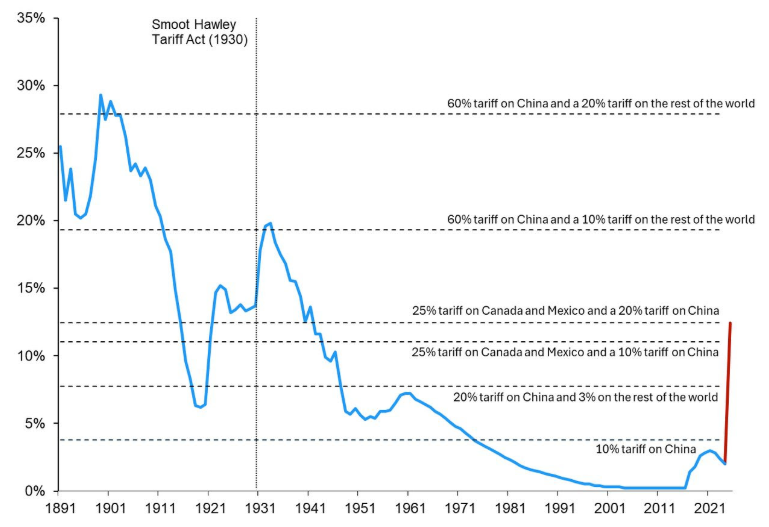
Also, an additional 10% tariff on Chinese imports took effect — on top of the 10% increase that went into effect last month. These tariffs are twice as large as those imposed during President Trump’s first term. The new tariffs will raise the average effective tariff rate that the U.S. imposes on imports from about 2% to 10%, which is something we haven’t seen since the 1930s and 1940s.
Average U.S. Tariff Rates
Sources: U.S. International Trade Commission, EY-Parthenon
It’s a challenge to assess the potential damage to economic activity, given the rapidly changing news events from the administration and the differing messages coming from the Secretary of Treasury, Elon Musk, or the president.
The sharp rise in policy uncertainty, combined with recent softening in business and consumer confidence, has led investors and the markets to worry about the dreaded R-word: recession. On-again, off-again tariffs, the reprieve for the auto industry and the likelihood that these tariffs are a negotiating tool to help achieve other policy goals, are causing the markets to take a risk-off approach, as we see money move out of the technology stocks that have worked so well the last two years.
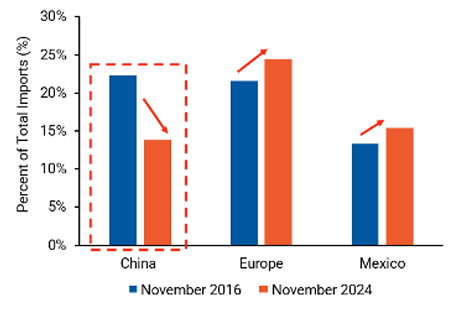
In Trump’s previous administration, we saw that tariffs did have an impact; consumers and business shifted their buying to countries that were not impacted by tariffs. Countries that were targeted by tariffs saw their prices rise more than other goods.
During the first term, the tariffs were more targeted and impacted just a small portion of the country’s imports. This time around, the tariffs that have been announced have a much larger potential impact because they are targeting a wider range of goods.
Trump Tariffs 1.0: Trade Patterns Shifted
Source: Goldman Sachs Global Investment Research with data from the U.S. Census Bureau and Haver Analytics
Tariffs can be an attractive tool for a president because they can be implemented without Congressional approval. They are easy to put on and to take off. If it becomes clear that tariffs are negatively impacting economic growth, they can be undone easily.
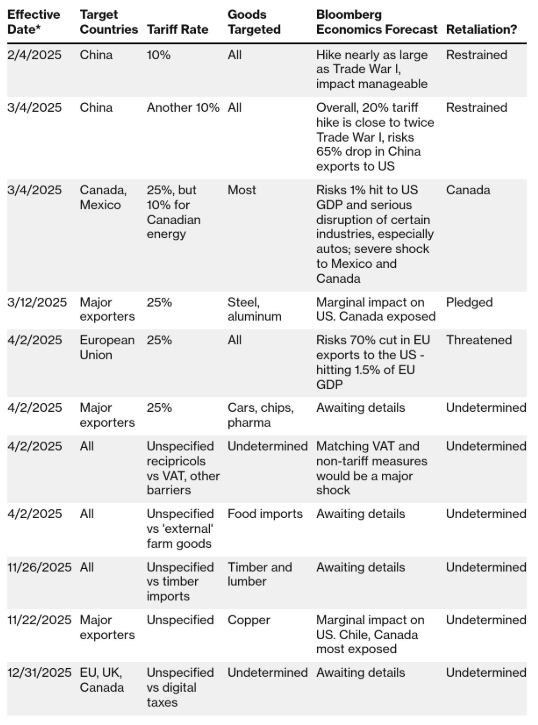
They will continue to be a dominant story for the stock market for the foreseeable future. U.S. trading partners may make trade policy moves of their own, and corporate executives will talk about the potential impact on their companies’ earnings.
Trump Tariffs So Far
Source: Bloomberg. Note: Data as of March 4, 2025. Future dates subject to change; for tariffs targeting digital taxes, date hasn’t been set yet.
We cannot predict where we go from here. We believe that the bull market is still ongoing — and that it has a ways to go. That doesn’t mean we won’t see significant volatility, like we are seeing now. The S&P 500 is almost in a correction mode (down almost 10% from recent highs), while the NASDAQ is firmly in correction mode.
It is important to remember that even the best years on record have had scary moments. In each of the the last two years, stocks gained more than 20% in the S&P 500, but it wasn’t always easy.
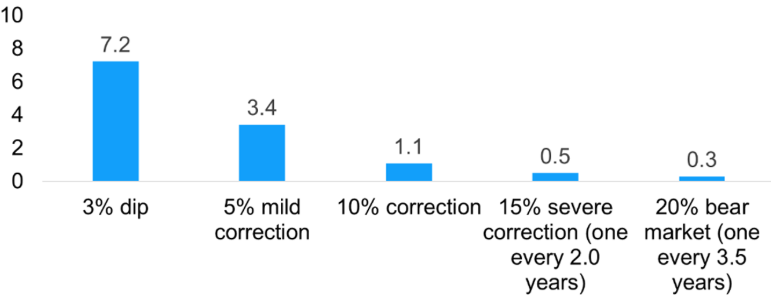
Remember the banking crisis in March 2023? Stocks dropped almost 10%, and then later that year, they dropped another 10%. Last year, we saw two mild corrections, with stocks dropping almost 9% in August. We have referred to this chart before, but now it is a great reminder that stocks drop at least 10% on average almost every year — and so far, 2025 is no different.
Volatility Is the Toll We Pay to Invest
S&P 500 various declines per year (1928-2024)
Sources: Carson Investment Research, Ned Davis Research
The CD Wealth Formula
We help our clients reach and maintain financial stability by following a specific plan, catered to each client.
Our focus remains on long-term investing with a strategic allocation while maintaining a tactical approach. Our decisions to make changes are calculated and well thought out, looking at where we see the economy is heading. We are not guessing or market timing. We are anticipating and moving to those areas of strength in the economy — and in the stock market.
We will continue to focus on the fact that what really matters right now is time in the market, not out of the market. That means staying the course and continuing to invest, even when the markets dip, to take advantage of potential market upturns. We continue to adhere to the tried-and-true disciplines of diversification, periodic rebalancing and looking forward, while not making investment decisions based on where we have been.
It is important to focus on the long-term goal, not on one specific data point or indicator. Long-term fundamentals are what matter. In markets and moments like these, it is essential to stick to the financial plan. Investing is about following a disciplined process over time.
Sources: Capital Group, Carson, CNBC, JP Morgan, Kestra Investment Management
The markets have been volatile in the second half of February and the beginning of March as worries over the economy,tariffs and technology stock weakness have dominated the headlines. The positive returns we saw in January have all but vanished.
February historically has been a weak month, so in many ways, what we are seeing is normal and not a reason to panic. It’s easy to forget that we are coming off back-to-back gains of 20% in the S&P 500 the past two years, and maybe a break is due. Just two weeks ago, we saw market highs in the S&P 500, but today, that feels like a long time ago.
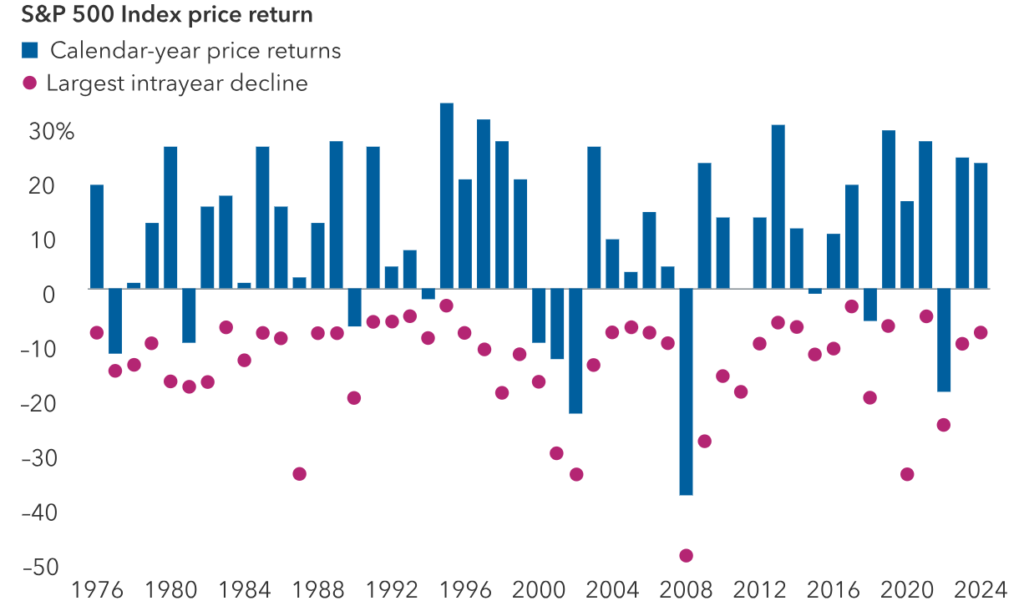
Over the past two decades, March and April historically have been two of the better months, while February has been one of the weakest. The chart below illustrates that markets have declines and pullbacks in every year. It’s a good reminder that downturns are regular and that we should learn to expect a few market surprises.
Market Declines Have Happened Every Year
Sources: Capital Group, Standard & Poor’s. As of Dec. 31, 2024.
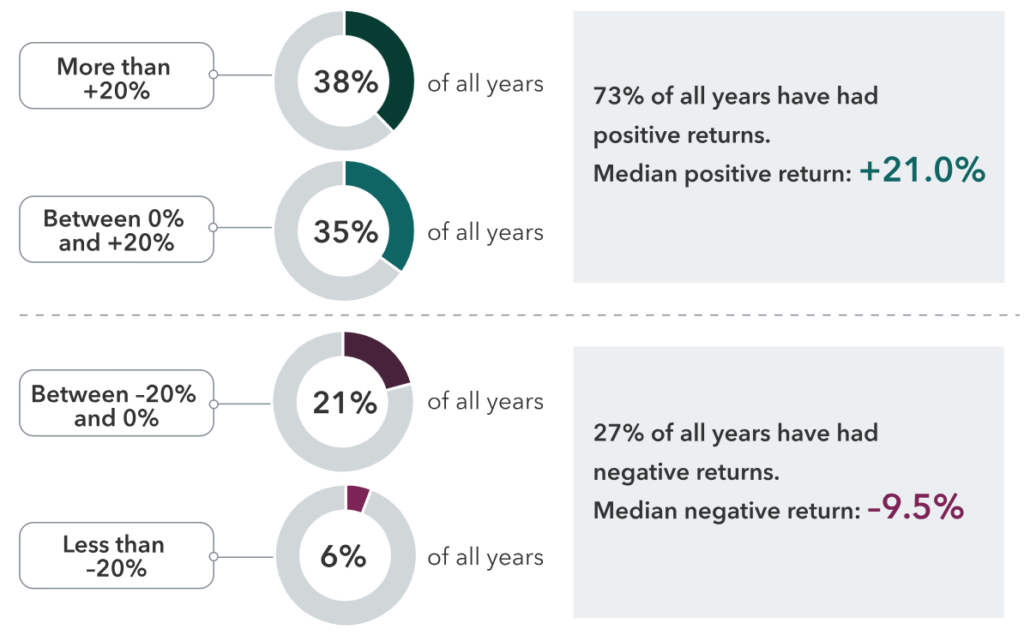
Going back to 1928, S&P 500 returns show that the market has been positive almost 75% of the time — three out of every four years on average! Stocks were negative only one in every four years on average.
The economic backdrop remains positive, bolstered by strong wage growth, steady rates and potential new policy designed to foster growth in America. These high expectations have led to valuations that may be elevated, but that doesn’t mean that everyone should abandon stocks.
S&P 500 Annual Total Returns, 1928-2024
Sources: Capital Group, Standard & Poor’s. As of Dec. 31, 2024.
Uncertainty around tariffs, federal layoffs and a weakening economy contributed to the markets’ performance in February. To put the layoffs into perspective, federal employees account for only about 1.5% of the workforce, and economists project that the job losses could account for less than .5% of current non-farm jobs in the U.S.
The Atlanta Fed recently estimated that the first-quarter GDP would be negative, dropping from +2.3% to -1.3%, based largely on the effect of tariffs on imports from Mexico, Canada and China. The tariffs have prompted retaliatory measures from those countries, along with concerns about economic growth and consumer prices.
There is no doubt GDP growth is likely to slow from the 3% annual pace we have seen the last few years, but the Atlanta Fed’s estimate does not take imports into account. While the headline number drew attention and cause for concern about potential recession, numbers alone don’t tell the whole story, as is often the case.
From a portfolio management perspective, we continue to look ahead — just as the markets are forward-looking, often telling us what may happen. With an eye on the future, we are making the following portfolio changes as we end the first quarter:
1. Diversifying Beyond the Magnificent Seven
Over the last two years, the markets have been dominated by the Magnificent Seven stocks – Apple, Amazon, Google, Meta, Microsoft, Nvidia and Tesla. Last year, we saw some early movement towards the other 493 stocks in the S&P 500. This year, we have really started to see the broadening out of the market, as the current leaders so far are some of the stocks that led the markets years ago.
That isn’t to say that the technology trade is dead — far from it, as investment in artificial intelligence is still in its infancy. From an equity perspective, we are maintaining our allocation to large-cap stocks as well as technology stocks. We are adding some additional exposure to value stocks as the market continues to move back toward a sense of normalcy regarding market breadth.
We also are tweaking our mid-cap exposure to make sure we maintain true exposure to the asset class. As is often the case with mid- and small-cap stocks, they tend to move either up or down in market cap as they grow or get acquired. Sometimes, they shrink due to market struggles or economic situations. Rebalancing the portfolio is important to capture and redistribute some of the winnings.
2. Rebalancing Fixed-Income Allocations
With the yield curve continuing to normalize and remaining un-inverted, we want to make sure the duration of the portfolio remains in line with the aggregate index. The longer-dated maturities at the end of the yield curve are more volatile than the short-end of the yield curve.
We have seen more volatility this year in the Treasury market as the markets try to understand which direction the Fed may be headed with interest rates and inflation. Like our equity allocation, it is important to rebalance our fixed-income allocations. From time to time, they need to be shifted to rightsize the positions and put them in position for where we see the markets heading.
We believe that when rates fall, we will be able to capture nice income, along with capital appreciation from rising bond prices.
Market sentiment has soured due to uncertainty. Talk of recession is starting to loom — and one of the biggest threats to your portfolio could be you.
Staying invested in the face of market turmoil is easier said than done. While your gut may compel you to sell to curb the downturn, getting out of the market — even for a short time — can be devastating to the portfolio.
We continue to maneuver the portfolio in response to where we think the puck is moving. We are not accustomed to a world where interest rates and inflation are higher. Financial markets, both stocks and bonds, are more volatile in response, which we have seen in the first two months of the year.
Staying in a diversified portfolio still is the key to navigating volatility. We will continue to monitor the portfolio and make changes to go to the puck, not wait for the puck to come to us.
The CD Wealth Formula
We help our clients reach and maintain financial stability by following a specific plan, catered to each client.
Our focus remains on long-term investing with a strategic allocation while maintaining a tactical approach. Our decisions to make changes are calculated and well thought out, looking at where we see the economy is heading. We are not guessing or market timing. We are anticipating and moving to those areas of strength in the economy — and in the stock market.
We will continue to focus on the fact that what really matters right now is time in the market, not out of the market. That means staying the course and continuing to invest, even when the markets dip, to take advantage of potential market upturns. We continue to adhere to the tried-and-true disciplines of diversification, periodic rebalancing and looking forward, while not making investment decisions based on where we have been.
It is important to focus on the long-term goal, not on one specific data point or indicator. Long-term fundamentals are what matter. In markets and moments like these, it is essential to stick to the financial plan. Investing is about following a disciplined process over time.
After just one month, 2025 already is feeling much different than 2024. The past two Mondays have started off with a bang: Last week, news out of China about an artificial intelligence startup made waves, and this week, top headlines focused on how potential tariffs may affect the markets.
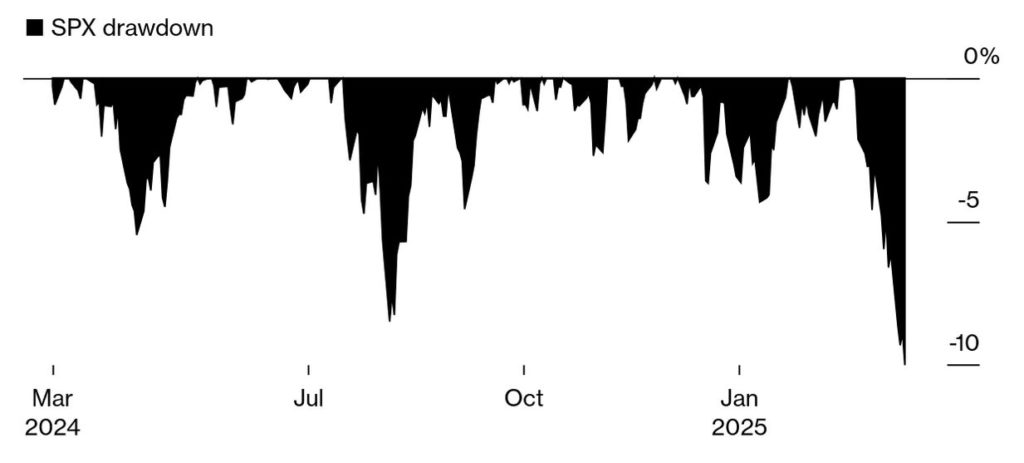
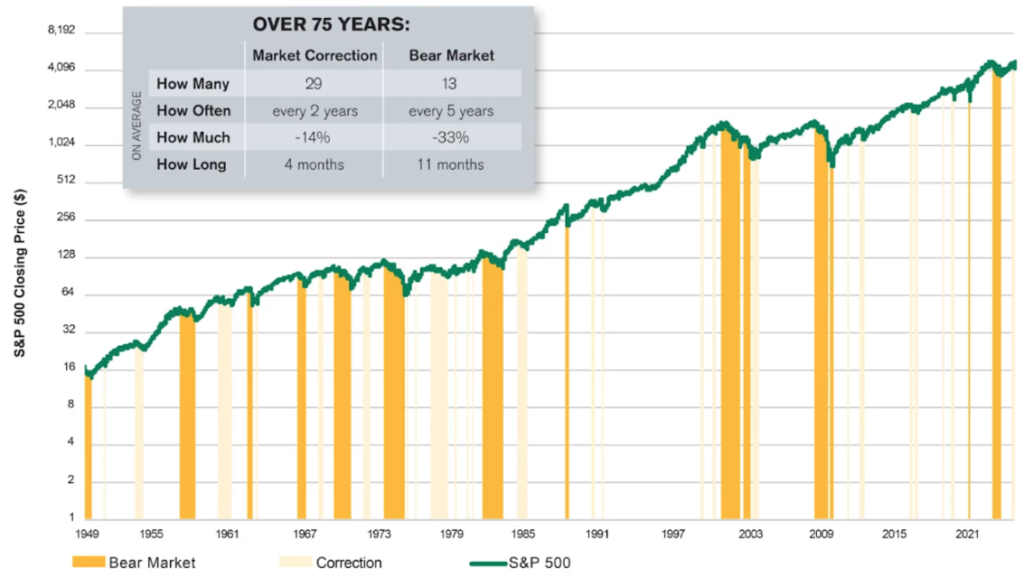
Last year was unusually quiet for volatility in stocks; the biggest pullback was 8.5%, well below the market’s average drawdown of 13%. For investors, it is important to remember that the market typically doesn’t move smoothly — or only in one direction. The market clearly shows an upward trend over time, but as seen in the chart below, there have been bumps in the road.
In the past 75 years, there have been 29 market corrections (when the market drops 10% from its peak). Bear markets occur much less frequently; there have been just 13 bear markets in the past 75 years, and two of those have been within the last five years. A key stat for investors: It takes an average of just four months for the market to recover a loss after a decline of 10%!
Average Length of Bear Markets and Market Corrections
Data from Jan. 1, 1949, to Dec. 29, 2023. Sources: FactSet and American Century Investments. Past performance is no guarantee of future results.
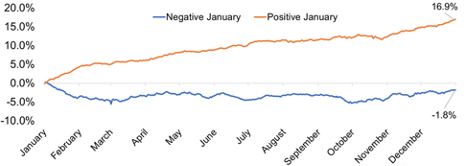
Even with the volatility we saw last week, the S&P 500 finished in the positive for the month of January. Historically, when January has been positive for the S&P, the rest of the year has been up an average of 16.9% and positive more than 86% of the time. This is a good sign for the rest of the year.
In the last few years, the Magnificent Seven stocks (Apple, Amazon, Alphabet, Microsoft, META, Nvidia and Tesla) and the development of AI have driven the market. Last week’s news of a new development in AI introduced new uncertainty into the market — along with new potential. A company out of China, DeepSeek, released an AI model that appears to be as powerful as existing ones, such as ChatGPT, but trained at a fraction of the computing cost. The accuracy of the reports has yet to be fully verified.
Founded in China in 2023, DeepSeek apparently used 10,000 Nvidia chips that it acquired in 2021, before export controls were imposed by the United States. Two weeks ago, DeepSeek released DeepSeek R-1, a more advanced reasoning model with innovative methods that reduced the training cost. The release sent the tech world into a brief frenzy, as DeepSeek took over the No. 1 spot for most downloaded free app in the U.S. Apple store, dethroning ChatGPT.
Until now, it looked like only a few of the largest tech companies had the financial and technological resources to compete and dominate the AI arena: Microsoft (ChatGPT), Google (Gemini) and Amazon (Claude). After the DeepSeek release, the AI sector is now awash with questions around the legitimacy of the cost, what it took to develop the application and the future implications of this development.
There is an economic theory called the Jevons paradox, which states that increased efficiency in the use of a resource can lead to an increased demand for the resource.
For AI, this could lead to a lower cost of chips, increasing demand of the chips and in turn causing resource use to increase. In turn, that could lead to additional capital spending — not less, as early news reports feared. Last week’s earnings calls from Meta and Microsoft indicated a full-steam-ahead approach on spending plans for AI, not a slowdown.
Ultimately, the market will reveal the AI battle’s winners and losers. The big-picture view is that AI will permeate the economy faster if the cost to access it is lower. Companies will ramp up their spending even more, which will be good for the growth of the economy and productivity of companies. In the interim, market pullbacks like we have seen the last two Mondays are par for the course.
The cause of the declines is always different, and the headlines can be scary. However, the key is to remain invested, stay diversified, and avoid making irrational decisions based on the headlines of the day.
The CD Wealth Formula
We help our clients reach and maintain financial stability by following a specific plan, catered to each client.
Our focus remains on long-term investing with a strategic allocation while maintaining a tactical approach. Our decisions to make changes are calculated and well thought out, looking at where we see the economy is heading. We are not guessing or market timing. We are anticipating and moving to those areas of strength in the economy — and in the stock market.
We will continue to focus on the fact that what really matters right now is time in the market, not out of the market. That means staying the course and continuing to invest, even when the markets dip, to take advantage of potential market upturns. We continue to adhere to the tried-and-true disciplines of diversification, periodic rebalancing and looking forward, while not making investment decisions based on where we have been.
It is important to focus on the long-term goal, not on one specific data point or indicator. Long-term fundamentals are what matter. In markets and moments like these, it is essential to stick to the financial plan. Investing is about following a disciplined process over time.
Sources: Fidelity, JP Morgan, American Century, Carson, Goldman Sachs
Note: A PDF version of this article is available here.
At CD Wealth Management, our philosophy with investing is to focus on the liquid markets — Stocks (Individual Equities), Fixed Income (municipal bonds, corporate bonds, Treasuries, CDs), Index Funds (ETFs), Mutual Funds, and money markets. We are not investing our clients’ monies in alternative investments — either liquid alternatives or illiquid alternatives.
To use a golf analogy, we play in the fairway. We want to ensure that if a client needs their money, whatever holdings are in the portfolio could be sold that day. It is paramount that clients have access to their monies when needed.
The Case for Liquid Investments
The financial world offers no shortage of investment opportunities. Over the years, a trend has emerged that has become popular to discuss at cocktail parties or on the golf course: illiquid partnerships and private deals, framed as exclusive opportunities and high-return potential. While they may appear enticing, these arrangements frequently prioritize the interests of general partners over investors.
These private deals and investments do not carry the same level of regulatory oversight, transparency, and accountability.
By contrast, liquid investments operate under strict oversight by regulators such as the Securities and Exchange Commission (SEC) and the Financial Industry Regulatory Authority (FINRA). These regulatory bodies ensure transparency and protect investors. Failure to comply with the regulatory agencies may lead to serious consequences, including fines and/or imprisonment.
Liquid investments may not carry the same flashiness as private deals, but they are tried, tested, and proven.
What Are Liquid Investments?
Liquid investments are financial assets that can be bought or sold quickly and easily without significantly affecting their price. These assets are traded on public exchanges, offering real-time valuations and high levels of transparency. Examples include:
Stocks: Stocks represent ownership in publicly traded companies. Stocks allow investors to participate in the growth and profitability of businesses. They are traded throughout the day on exchanges like the NYSE or NASDAQ and are valued daily.
Bonds: Fixed-income securities are issued by governments, municipalities, or corporations. Bonds provide a stream of income through interest payments and are considered a much lower risk than stocks.
Marketable Securities: Mutual funds and exchange-traded funds (ETFs) are liquid investments designed to diversify portfolios while maintaining daily liquidity. ETFs can be sold throughout the day, like stocks, while mutual funds have daily liquidity at the end of the trading day.
Cash Equivalents: Assets like Treasury bills, money market funds or short-term certificates of deposit (CDs) are as good as cash. These provide immediate access to funds with minimal risk.
Stocks are traded throughout the day on exchanges like the NYSE or NASDAQ and are valued daily, so investors can see the exact value of their holdings at any time.
How Liquid Investments Work: The Value of Transparency and Management
Liquid investments operate with transparency:
Daily Valuation: Investors can see the exact value of their holdings at any time. This removes ambiguity and allows for informed decision-making.
Professional Asset Management: Investors pay a transparent management fee to professionals who manage their investments. Management fees for liquid investments are disclosed upfront and published online, providing complete transparency about costs. Unlike illiquid investments, managers of liquid assets do not take a share of the profits.
Accountability: Regulatory oversight by the SEC and FINRA ensures that managers act in the best interest of their clients. This eliminates conflicts of interest and ensures ethical behavior.
Accessibility: Investors can buy or sell these assets quickly and with minimal impact on their value, making them ideal for individuals who may need access to cash in emergencies or for other financial goals.
What Are Illiquid Investments?
Illiquid investments are financial assets that cannot be easily or quickly converted into cash. These investments often come with long lock-up periods, a lack of transparency, and high levels of uncertainty regarding their valuation. Investors in illiquid investments typically face challenges when they want to sell or redeem their investments, as there is no open market to provide daily liquidity.
Types of Illiquid Investments
Private Real Estate Deals: Investors pool money to purchase or develop properties, often in the form of limited partnerships. Returns are tied to property appreciation or rental income but often require years before seeing liquidity.
Oil and Gas Ventures: Investments in exploration, drilling, and extraction projects typically are structured as partnerships. They are highly speculative and dependent on volatile commodity markets. Organizers may offer tax advantages as incentives to invest in the project.
Private Equity Funds: A fund invests in privately held companies or leveraged buyouts of public companies. The fund typically invests in private companies with a predetermined investment strategy. The types of private equity strategies are venture capital or buyout funds. Illiquid by nature, these funds typically lock up money for seven to 10 years or more.
Venture Capital: These are early-stage investments in startups or small businesses, typically with a minority investment in the company. Returns are speculative and contingent on the company’s success.
Hedge Funds: Hedge funds are actively managed funds that use complex strategies to generate returns and protect against market losses. They often have lock-up periods and redemption restrictions, making them illiquid. They also charge higher fees and have fewer regulations.
Collectibles and Art: With investments in rare items like artwork, antiques, or wine collections, illiquidity arises from the difficulty in finding buyers and determining fair market value.
Real Assets: Tangible assets like timberland, farmland, or infrastructure investments typically require long-term commitments with limited liquidity.
Hedge funds use complex strategies to generate returns and often have lock-up periods and redemption restrictions, making them illiquid.
How Illiquid Investments Work
General Partners with No Real Stake: In many private real estate deals, the general partner does not put their own money into the project. Instead, they use investor capital and bank loans, bearing little to no financial risk themselves. The general partner often takes a management fee and a significant share of the profits (sometimes 50% or more). This profit-sharing occurs even though the limited partners bear all the financial risk.
Leveraging Investor Capital: General partners use investor funds to secure loans, further leveraging the investment. If the project fails, investors lose their capital while the general partner remains protected.
Opaque Reporting: Illiquid investments often rely on unaudited reports produced by the general partner. These reports highlight irrelevant successes or inflated valuations while obscuring the true financial picture.
Lack of Oversight: Without SEC or FINRA oversight, investors have no external authority ensuring fair play or ethical behavior.
Why We Stay Away from Illiquid Investments
Lack of Transparency: Illiquid investments, such as private real estate deals, venture capital, and oil and gas partnerships, often lack daily pricing and rely on unaudited, self-reported valuations from general partners. This may leave investors in the dark about the true value of their investments and limits their ability to make informed decisions. Without regulatory oversight, there is no guarantee that reports are accurate or unbiased, creating a significant risk for investors.
Imbalanced Risk and Reward: In many illiquid investments, general partners contribute little to no capital but reap substantial rewards, including management fees and up to 50% of the profits. Meanwhile, limited partners bear all the financial risk. This misalignment of incentives can lead to decisions that prioritize the general partner’s interests over the investors’ interests, potentially resulting in losses or suboptimal outcomes for the limited partners.
Restricted Access and Estate Planning Challenges: Illiquid investments often come with long lock-up periods, tying up investor funds for years or even decades. This lack of accessibility can be problematic for those who need liquidity for personal reasons or to settle estates after death. Executors and heirs face delays, subjective valuations, and legal hurdles when trying to access or liquidate illiquid assets, adding unnecessary complexity and financial stress.
A Stronger Conclusion: Transparency Over Illusion
Investing should never feel like guessing. Illiquid investments thrive on a lack of transparency, emotional manipulation, and the allure of exclusivity. Having a mix of liquid assets can help you achieve your financial goals while also providing a safety net in times of uncertainty when money may be needed most.
Understanding the pros and cons of each type of asset — liquid or illiquid — is critical in making informed decisions as to what is right for each person and family based on their financial needs.
When it comes to your financial future, the choice is clear: Choose transparency, accountability, and liquidity. Your wealth deserves nothing less.
The CD Wealth Formula
We help our clients reach and maintain financial stability by following a specific plan, catered to each client.
Our focus remains on long-term investing with a strategic allocation while maintaining a tactical approach. Our decisions to make changes are calculated and well thought out, looking at where we see the economy is heading. We are not guessing or market timing. We are anticipating and moving to those areas of strength in the economy — and in the stock market.
We will continue to focus on the fact that what really matters right now is time in the market, not out of the market. That means staying the course and continuing to invest, even when the markets dip, to take advantage of potential market upturns. We continue to adhere to the tried-and-true disciplines of diversification, periodic rebalancing and looking forward, while not making investment decisions based on where we have been.
It is important to focus on the long-term goal, not on one specific data point or indicator. Long-term fundamentals are what matter. In markets and moments like these, it is essential to stick to the financial plan. Investing is about following a disciplined process over time.
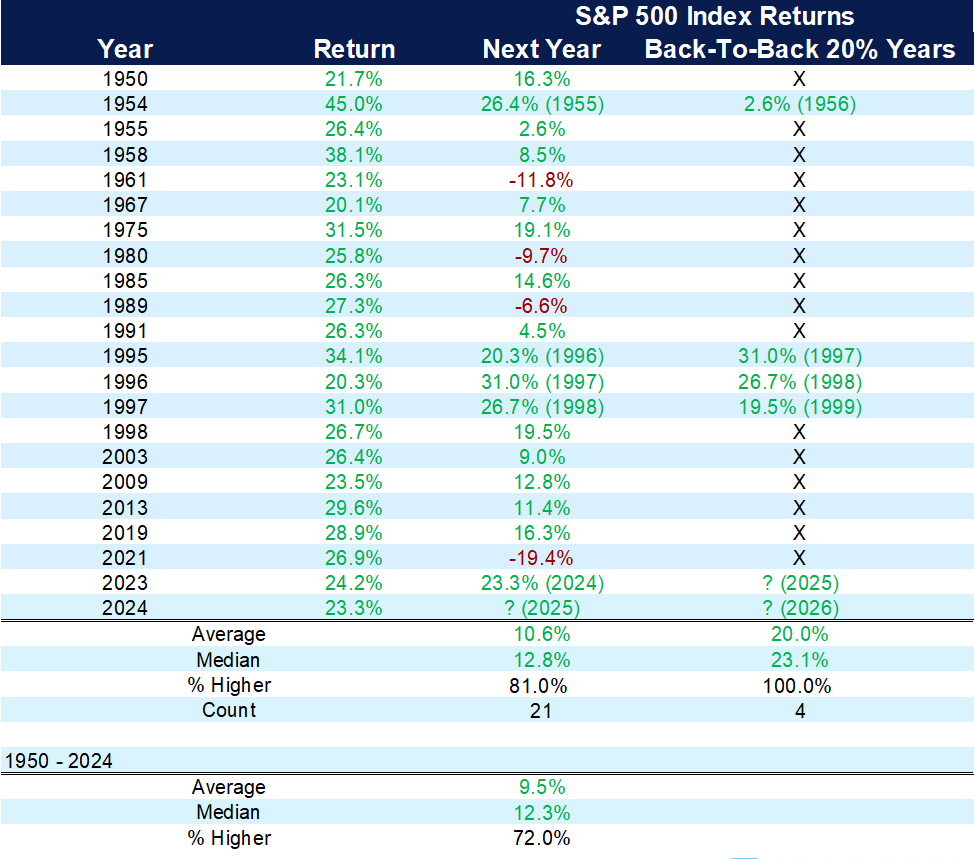
For the second year in a row, the S&P 500 gained more than 20% in 2024, marking the first time that’s occurred since the late 1990s. In each of the last four times there have been back-to-back gains of over 20% since 1950, the market has been higher — potentially a good sign for the year ahead.
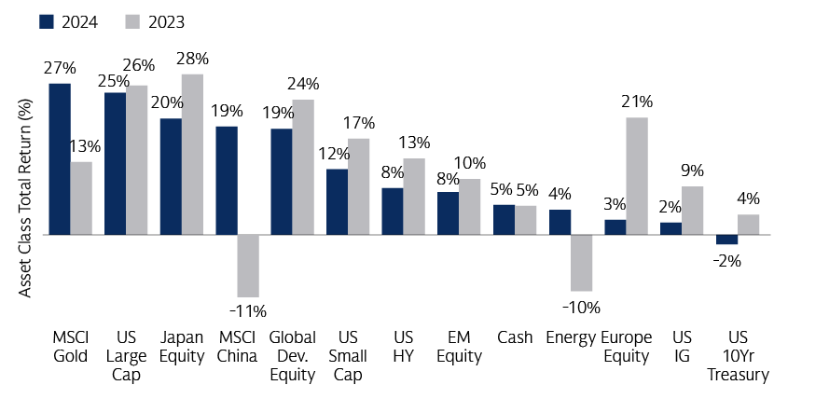
Large-growth stocks continued to lead last year, while small-cap stocks and large-value stocks lagged, gaining less than half of large-cap stocks. The Material sector in the S&P 500 was the only sector to finish negative for the year.
The Magnificent Seven stocks — Apple, Amazon, Google, Meta, Microsoft, Nvidia and Tesla — returned more than 66% in 2024, boosting gains in the S&P 500 again. Magnificent Seven stocks saw a wider dispersion of returns compared to 2023. Nvidia led the way, up over 170%, and Microsoft brought up the rear, returning only 12% while being the only member to underperform the S&P 500.
The 10 largest stocks in the S&P 500 increased their weight to nearly 40% of the index. Only 19% of the stocks within the S&P 500 outperformed the index itself. The S&P 500 had a maximum drawdown during the year of 8% from its 2024 high, falling short of a 10% correction in 2024. However, both the NASDAQ and Russell 2000 fell more than 10% during the year.
2024 In Review
Sources: Bloomberg, Goldman Sachs Asset Management. As of Dec. 31, 2024.
Given the narratives surrounding the election and the upcoming change in administration, the post-election aggressive market gains receded sharply to end the year. The S&P stumbled into the end of the year, with the last all-time close for the year occurring on Dec. 6.
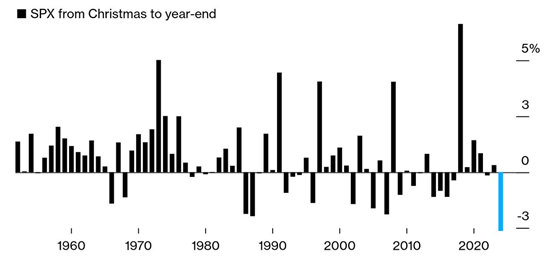
Investors were hoping for a Santa Claus Rally; since 1950, the S&P 500 has averaged a 1.3% gain during the last five trading days of the year and the first two of the new year. Unfortunately, Santa Claus did not come for the market this year; the S&P ended 2024 on a five-day losing streak, down 1.5%. Despite those results, the market had another great year!
The S&P 500’s Worst Year-End Fall Since 1952
Source: Bespoke Investment Group
Each year, there are defining themes that dominate the markets. In 2020 it was the global pandemic, which caused the supply chain issues of 2021. In 2022, it was all about inflation. Artificial intelligence and the Magnificent Seven led the way the last two years.
Some of these themes can be positive, while others are negative. One thing that is consistent is that one theme always gives way to another — a good reminder to not chase the annual theme and stick with the investment plan. We cannot predict what theme will dominate the markets in 2025.
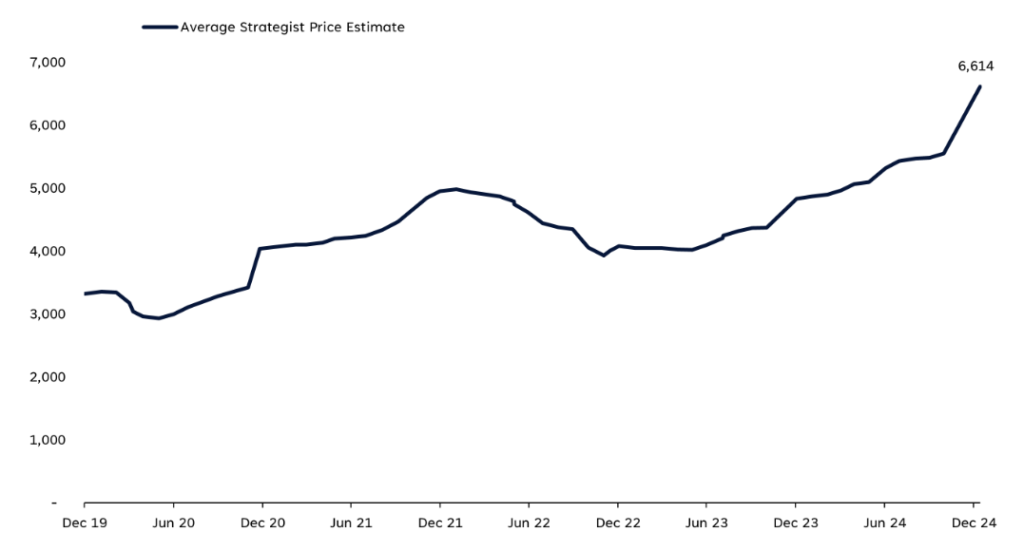
A survey of 15 Wall Street firms arrived at a predicted median S&P 500 value of 6,600 by the end of 2025, a gain of roughly 9% from recent levels. Estimates range from 6,000 to 7,100 on the S&P. Analysts have underestimated the index each year since 2019, with 2022 being the exception when the market fell more than 18%.
The 2025 aggregate forecast is the most bullish forecast since 2022, as the broad consensus is another positive year for stocks, with the bull market reaching its third anniversary during 2025. At the end of the day, though, these are predictions, and no one knows for sure how this year will play out. What we know is that over time, markets tend to rise — and staying invested is the best strategy.
Average Strategist Price Estimate
Sources: LPL Research, Bloomberg 12/30/24. All indexes are unmanaged and cannot be invested in directly. Past performance is no guarantee of future results. Estimates may not materialize as predicted and are subject to change.
We do see many reasons to be bullish in 2025:
1. The economic foundation remains in good shape headed into the new year.
2. Continued advancement in artificial intelligence leads to innovation among all sectors and industries. Companies continue to spend billions of dollars on infrastructure and AI buildout for the future.
3. Earnings for companies in the S&P 500 are expected to grow by double digits again for 2025, following very strong earnings growth in 2024.
4. Don’t mix politics with investing. Markets have gone up over time, no matter who has been in the White House.
5. Trump 2.0 is expected to reduce regulation and cut taxes. Markets are expecting deregulation that in turn will help foster more merger and acquisition activity.
6. Congress is expected to tackle major tax legislation and extend the Tax Cuts and Job Act that was initially passed in 2017.
7. The Fed is expected to cut rates twice in 2025 due to higher growth of the economy and is expected to keep the bull market intact headed into its third year.
8. The bull market has advanced more than 67% in the two-plus years since it started in October 2022. History suggests that the bull market has a good chance of celebrating its third anniversary.
9. We expect more balanced growth across the U.S. economy, and we expect the U.S. economy’s continued leadership. Earnings and valuations together suggest the strong potential for a continued broadening of the market.
We expect market volatility to be higher in 2025, as there are more unknowns heading into the year, as well as markets that are more fully valued. Higher volatility may cause some worry. Every year there are scary headlines; ignore them.
Market pullbacks are normal, and while markets have gone up over time, they do not climb in a straight line. Since 1980, the S&P 500’s average peak-to-trough correction per year is 14.2%. In 2024, the S&P 500 did not have a correction as an index but came within 1.5% of entering correction mode.
Even strong years have market pullbacks. It is very rare that the market doesn’t have at least a 5% pullback at some point. When the inevitable pullback and correction do occur, we will continue to stay the course and be here as your guide throughout the year.
The CD Wealth Formula
We help our clients reach and maintain financial stability by following a specific plan, catered to each client.
Our focus remains on long-term investing with a strategic allocation while maintaining a tactical approach. Our decisions to make changes are calculated and well thought out, looking at where we see the economy is heading. We are not guessing or market timing. We are anticipating and moving to those areas of strength in the economy — and in the stock market.
We will continue to focus on the fact that what really matters right now is time in the market, not out of the market. That means staying the course and continuing to invest, even when the markets dip, to take advantage of potential market upturns. We continue to adhere to the tried-and-true disciplines of diversification, periodic rebalancing and looking forward, while not making investment decisions based on where we have been.
It is important to focus on the long-term goal, not on one specific data point or indicator. Long-term fundamentals are what matter. In markets and moments like these, it is essential to stick to the financial plan. Investing is about following a disciplined process over time.
Sources: Schwab, LPL, Bloomberg, Carson, JP Morgan, Capital Group
As 2024 draws to a close, we wanted to take this occasion to look back at the articles we’ve produced for our clients so far this year and share the 10 most popular pieces, in case you missed any of them — or if you want to revisit and share them with friends and family.
Every two weeks, we thoughtfully craft these pieces with our clients in mind, broaching subjects we think are relevant and interesting. This is not syndicated content. We want you to find value in these letters — especially in times like these.
1. Understanding How a Living Trust Can Help Your Estate Planning
June 20: A living trust is a flexible, popular tool that allows the estate to avoid probate and lets you control asset distribution after your death. Read more
2. Another Milestone for the Dow: What Could Happen Next?
May 23: The Dow’s rise to 40,000 is a reminder that when it comes to investing, patience is the key. Read more
3. Here’s Why Investors Shouldn’t Panic Over the Market’s New Year’s Hangover
Jan. 12: We talk regularly about not timing the market, and we don’t see these circumstances any differently. Read more
4. Election Advice for Investors: Ignore the Noise, Focus on the Big Picture
Oct. 31: Presidential elections historically have had very little impact on the stock market. Read more
5. What Investors Should Know About This Week’s Market Pullback
Aug. 8: Remember that volatility is normal and that the market does not go up in a straight line. Read more
6. The Market’s Recovery Puts August Pullback in the Rearview Mirror
Aug. 22: More often than any other month, August is when we tend to see out-of-the-blue volatility in the stock market. Read more
7. Here’s How We’re Rebalancing the Portfolio as We Enter the Second Quarter
March 15: We think much of the pain from rising interest rates is behind us — and the key to navigating volatility remains being in a diversified portfolio. Read more
8. Investor Outlook: A Strong May, the First 100 Trading Days and 4 Scams to Watch
June 6: S&P 500 companies are enjoying their best earnings season in almost two years. Read more
9. The Fed’s Next Move: What Could Rate Cuts Mean for Investors?
Sept. 5: Investors who stay only in short-term investments may risk an opportunity to lock in higher yields. Read more
10. How To Make the Biggest Impact With Your Charitable Donation
Sept. 19: Giving can offer a financial benefit for you and your family — as well as the intangible rewards that come with helping others. Read more
The CD Wealth Formula
We help our clients reach and maintain financial stability by following a specific plan, catered to each client.
Our focus remains on long-term investing with a strategic allocation while maintaining a tactical approach. Our decisions to make changes are calculated and well thought out, looking at where we see the economy is heading. We are not guessing or market timing. We are anticipating and moving to those areas of strength in the economy — and in the stock market.
We will continue to focus on the fact that what really matters right now is time in the market, not out of the market. That means staying the course and continuing to invest, even when the markets dip, to take advantage of potential market upturns. We continue to adhere to the tried-and-true disciplines of diversification, periodic rebalancing and looking forward, while not making investment decisions based on where we have been.
It is important to focus on the long-term goal, not on one specific data point or indicator. Long-term fundamentals are what matter. In markets and moments like these, it is essential to stick to the financial plan. Investing is about following a disciplined process over time.
November was a big month for stocks! The Dow closed above 45,000 for the first time, and the S&P 500 hit 6,000 for the first time. Small-cap stocks rose almost 11% during the month.
Optimism over lower taxes, a stronger economy and strong earnings were the likely reasons for the month’s great showing. So far in 2024, the S&P has made 56 new all-time highs. The S&P is up more than 25% for the year — and for the first time since 1998, it’s up more than 20% in back-to-back years.
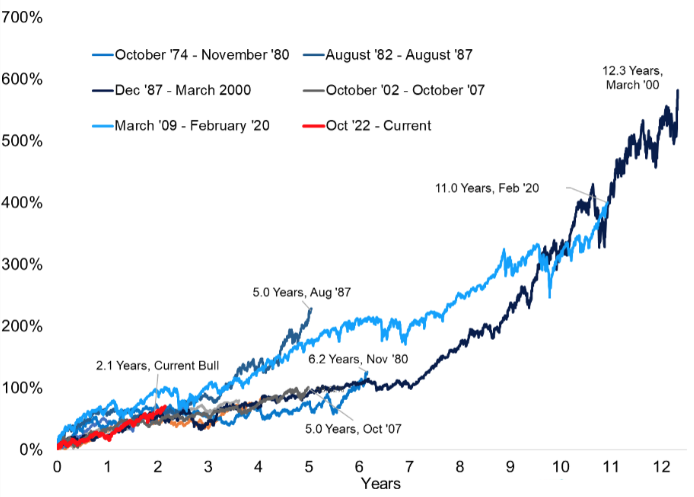
The current bull market is 26 months old and up more than 70% from lows in mid-October 2022. The good news is that once previous bull markets get to this point, there can still be additional room to go higher. Over the past 50 years, five other bull markets have lasted more than two years. The shortest lasted five years, and the longest lasted more than 12 years.
Bull Markets Beyond Their Second Birthday
Source: FactSet, Carson Investment Research 12/6/24
Here are some fun market tidbits to end the year:
1. The “Santa Claus rally” is the typically encouraging period that includes the last five trading days of December and the first two trading days of the new year. 2. December typically is the S&P 500’s second-best month in an average election year, trailing only November. 3. On average, December is the third-best month, behind April and November. 4. Going back to 1950, December has been positive 75% of the time.
Santa brings gifts — and not always in the form of market returns. The IRS recently released its inflation adjustments for 2025 related to personal income tax, retirement contributions, estate taxes and Social Security benefits. While these changes won’t affect tax returns due in April, they will be very helpful in planning for 2025.
Personal Income Tax
The standard deduction is increasing in 2025, which could mean a bigger tax break for you. The new standard deduction for 2025 is:
• Married filing jointly: $30,000, an increase of $800 • Single taxpayers and married individuals filing separately: $15,000, up $400 • Heads of Households: $22,500, an increase of $600 • In addition, retired married couples (both age 65+) filing jointly, will receive an additional standard deduction of $3,200 ($1,600 each)! This may make it more difficult to itemize deductions in 2025. We will want to keep this in mind with charitable giving to consider a bunching strategy.
For tax year 2025, the top tax rate remains 37% with income greater than $751,600 for married filing jointly ($626,350 for single taxpayers). The other tax brackets are:
• Incomes over $501,050 for married filing jointly ($250,525 for single): 35% • Incomes over $394,600 for married filing jointly ($197,300 for single): 32% • Incomes over $206,700 for married filing jointly ($103,350 for single): 24% • Incomes over $96,950 for married filing jointly ($48,475 for single): 22% • Incomes over $23,850 for married filing jointly ($11,925 for single): 12% • Incomes less than $23,850 for married filing jointly ($11,925 or less for single): 10%
Retirement Savings Contributions
The 401(k)-contribution limit is increasing by another $500 to $23,500. The maximum contribution for certain profit-sharing plans is increasing to $70,000.
Traditional and Roth IRA contribution limits are staying the same at $7,000. In 2025, for those under the age of 50, the cap will remain at $7,000. Married couples with income below $236,000 will be able to make a full Roth contribution in 2025 ($150,000 for those who are single). Phaseout ranges are changed for 2025; couples with income over $246,000 will not be eligible to contribute to a Roth IRA.
While catch-up contributions for participants 50 and older will remain at $7,500, the IRS is introducing a new super catch-up contribution limit for older employees. Beginning in 2025, individuals age 60-63 can contribute an additional $3,750 to their employer-sponsored retirement plans, for a total catch-up amount of $11,250.
The backdoor Roth IRA option remains a viable choice. The first step is to contribute to a Traditional IRA; this is a non-deductible contribution. After the traditional IRA contribution is completed, you can convert those funds to a Roth IRA.
If the original contribution to a traditional IRA was not deductible, then the conversion of that amount is non-taxable. However, any growth on that amount between the contribution and the conversion dates would be taxable. Completing the backdoor Roth transaction can be a tricky process, and you will want to consult your financial advisor and CPA.
Please make sure you adjust your 401(k) plan to account for the increased contribution limit.
Social Security
Social Security benefits will increase 2.5% in 2025, an average increase of almost $48 per month. This adjustment is smaller when compared to the 5%-8% increases that were in response to higher inflation in recent years.
Estate Taxes and Gifting
The gift tax annual exclusion is increasing from $18,000 to $19,000 for 2025, the fourth consecutive year that the gift limit has increased. Individuals can gift up to this amount to any number of individuals in 2025 without incurring gift tax or using any of the taxpayer’s lifetime exemption. Married couples can use this exemption, allowing them to gift up to $38,000 annually to each recipient in 2025.
In addition, the lifetime exemption amount increased about $380,000 per person, to $13.99 million per individual. This increase means that a married couple can shield a total of $27.98 million from federal estate or gift tax. This exemption is still set to sunset by about 50% at the beginning of 2026. Remember, however, that certain kinds of planning strategies can take months or even years to implement.
The end of the year is a perfect time to review your financial planning needs. This includes reviewing the investment portfolio, assessing year-end tax planning opportunities, reviewing retirement goals, and managing your legacy plans. The above changes for 2025 may apply to you and your family. We are happy to meet to discuss any of the above to ensure that you remain on track with your financial goals.
The CD Wealth Formula
We help our clients reach and maintain financial stability by following a specific plan, catered to each client.
Our focus remains on long-term investing with a strategic allocation while maintaining a tactical approach. Our decisions to make changes are calculated and well thought out, looking at where we see the economy is heading. We are not guessing or market timing. We are anticipating and moving to those areas of strength in the economy — and in the stock market.
We will continue to focus on the fact that what really matters right now is time in the market, not out of the market. That means staying the course and continuing to invest, even when the markets dip, to take advantage of potential market upturns. We continue to adhere to the tried-and-true disciplines of diversification, periodic rebalancing and looking forward, while not making investment decisions based on where we have been.
It is important to focus on the long-term goal, not on one specific data point or indicator. Long-term fundamentals are what matter. In markets and moments like these, it is essential to stick to the financial plan. Investing is about following a disciplined process over time.