Stocks reached new highs again last week, the fifth week in a row that the S&P 500 has had positive returns. The S&P now has reached 46 new all-time highs this year, which ranks as the ninth-most ever — and we still have two and a half months to go.
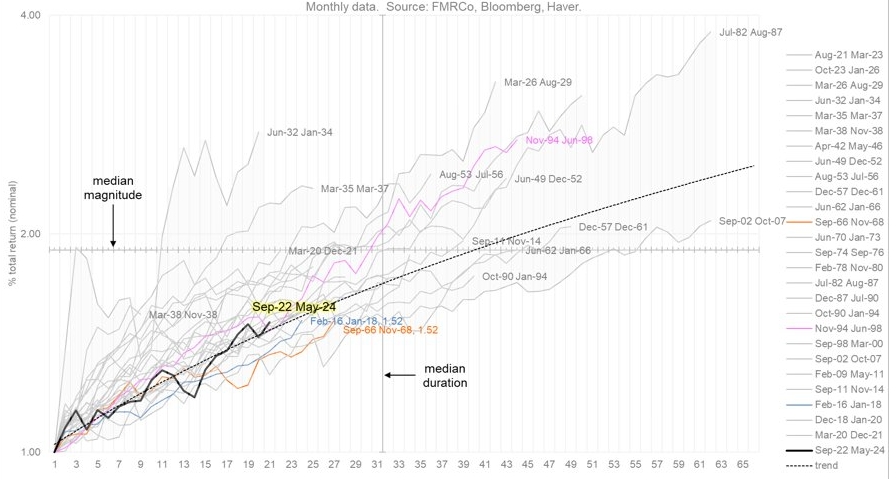
The current bull market is 2 years old as of last Saturday, following a 25% drop in stocks in 2022 that coincided with a steep drop in bond returns as well. Since 1950, the average bull market has lasted more than 5 years and has gained more than 180%. Based on history, we know the market does not go up in a straight line, and plenty of upside remains.
The Bull Market Is Still Young
S&P 500 bull markets from 1950 to today

For now, political uncertainty appears to be doing little to dampen enthusiasm for stocks. Strong economic growth has helped the S&P 500 reach its new highs; it is up over 20% for the year and is on track for the second straight year of double-digit gains.
Still, election anxiety may be on investors’ minds. The VIX, which measures market volatility, has risen about 25% since late September. Some of the increase is attributable to the election and concern that we may not know the outcome immediately following Election Day. Markets do not like uncertainty.
Every four years, investors may worry about what to do with their portfolio as the election nears. History shows that over the long term, the stock market tends to be relatively indifferent to who is in office.
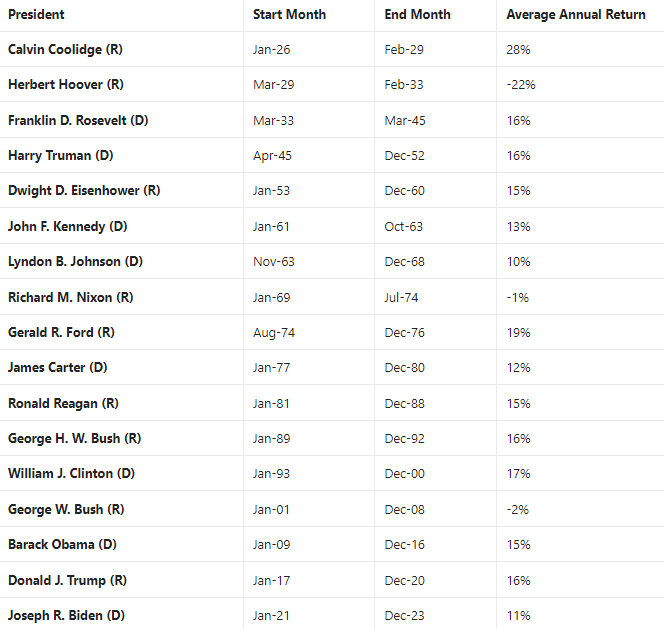
Since 1926, the market has seen negative returns only three times in 17 presidential administrations. One came during the Great Depression under Herbert Hoover, and another came during the Great Recession under George W. Bush. During Richard Nixon’s time in office, the U.S. suffered through the Vietnam War and two recessions — and suffered average losses of only 1% per year.
Politics can bring out strong emotions and biases, but as we have said before, investors would be wise to tune out the noise and focus on the long-term fundamentals. Political opinions are best expressed at the polls, not through your portfolio. Historically speaking, election results have made almost no difference when it comes to long-term investment returns.
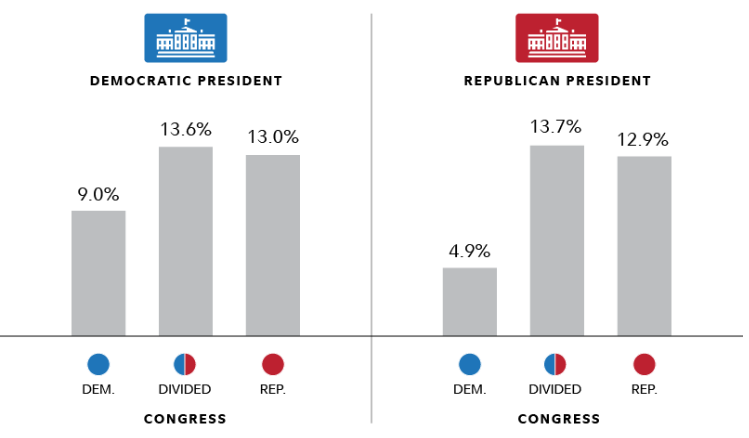
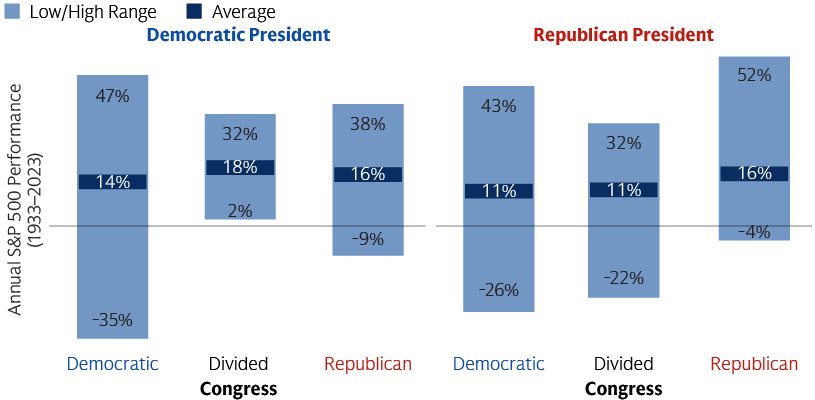
History also shows that stocks have done well regardless of which party is in control in Washington. Since 1933, there have been eight Democratic presidents and seven Republican presidents. The chart below shows how the market has performed on average under each scenario for the party in control of the White House and Congress. In that time, the worst average annual return was 11% — to the positive.
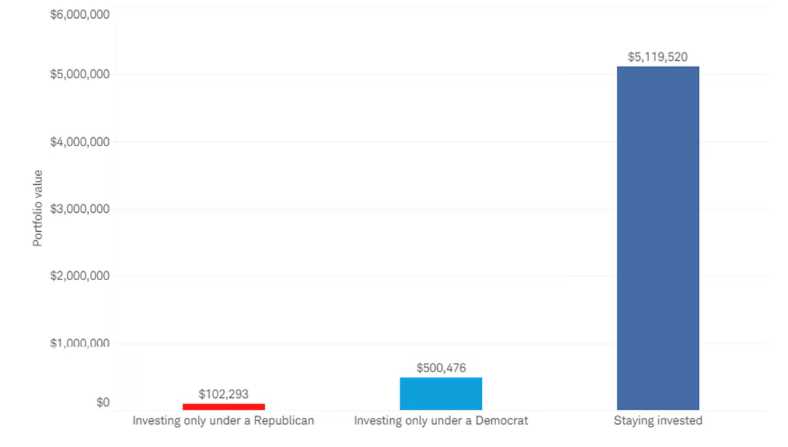
Investors who allow political opinions to harm their investing discipline have missed out on above-average returns during presidents they don’t like.
The chart below shows that if you invested $10,000 in 1961, it would have grown to more than $102,000 by 2023 if you invested only during a Republican presidency. If you invested the same $10,000 in 1961, that same investment would have grown to $500,000 if you invested only while a Democrat was in the White House. However, that $10,000 investment would be worth more than $5.1 million if you just stayed invested no matter who was in office.
Growth of $10,000 (1961-2023)
Investors should not let their political opinions or emotions dictate their decisions. The markets really don’t care about the results or the daily micro-dramas in the presidential race. Markets are much more likely to be influenced by corporate earnings, economic data and monetary policy.
As James Carville said back in 1992, “It’s the economy, stupid.”
Unemployment remains near historic lows. Inflation has dropped from a post-pandemic high of 9% to 2.4%. The stock market is at new highs, and interest rates and energy prices are on the decline. Long-term investment strategies tend to perform well regardless of who occupies the White House.

The CD Wealth Formula
We help our clients reach and maintain financial stability by following a specific plan, catered to each client.
Our focus remains on long-term investing with a strategic allocation while maintaining a tactical approach. Our decisions to make changes are calculated and well thought out, looking at where we see the economy is heading. We are not guessing or market timing. We are anticipating and moving to those areas of strength in the economy — and in the stock market.
Our focus remains on long-term investing with a strategic allocation while maintaining a tactical approach. Our decisions to make changes are calculated and well thought out, looking at where we see the economy is heading. We are not guessing or market timing. We are anticipating and moving to those areas of strength in the economy — and in the stock market.
It is important to focus on the long-term goal, not on one specific data point or indicator. Long-term fundamentals are what matter. In markets and moments like these, it is essential to stick to the financial plan. Investing is about following a disciplined process over time.
Sources: BlackRock, Capital Group, Carson, CNBC, Dimensional Funds, Fidelity, Schwab