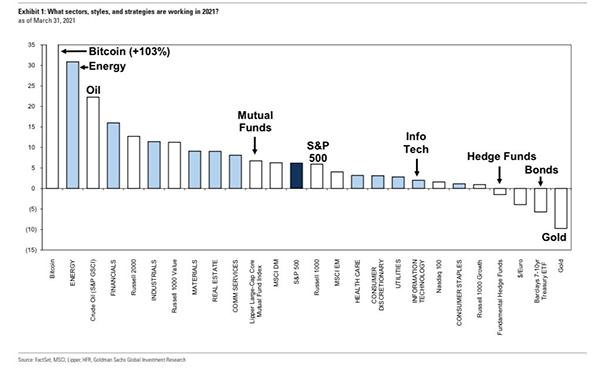
In May, Tesla CEO Elon Musk sent shockwaves through the cryptocurrency market when he tweeted that Tesla had suspended its practice of accepting Bitcoin for vehicle purchases and that it would halt sales of the Bitcoin it had purchased. It was a startling change because, as we wrote in February, Tesla helped Bitcoin surge to a record high when it bought $1.5 billion worth.
The reason for Musk’s recent reversal: the environment. “We are concerned about rapidly increasing use of fossil fuels for Bitcoin mining and transactions, especially coal, which has the worst emissions of any fuel,” he wrote.
Confusing, right? How can Bitcoin and other cryptocurrencies, like Ethereum, be bad for the environment?

A report by Cambridge University states that Bitcoin mining uses 116 terawatt hours of energy consumption per year, which equals .5% of total global electricity consumption. (By the way, 1 terawatt equals 1 trillion watts.) To put that amount into context: Bitcoin miners use more energy than several countries, including Singapore and the Netherlands. In fact, if a country used that much energy, it would be in the top 35 of all countries in the world for energy consumption.
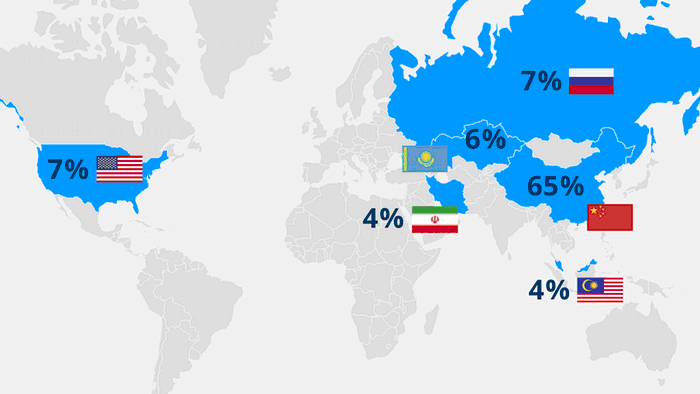
As the price of Bitcoin rises, more miners are logging in and mining for it and other cryptocurrencies in the hopes of becoming rich. For those areas of the world that rely on fossil fuels for energy versus renewable energy, more mining means more “dirty” energy consumption, which is worse for the environment. This is especially notable because roughly 65% of all mining for cryptocurrency takes place in China, which is the world’s largest greenhouse gas emitter.
China and the U.S. are cracking down again on the business of mining cryptocurrency and warning about the speculative nature of the currency. Last week, authorities in China ordered cryptocurrency miners to shut down their operations in the Sichuan province. This is not the first time China has taken action; in 2017, officials issued similar edicts forcing cryptocurrency mining offshore from mainland China.
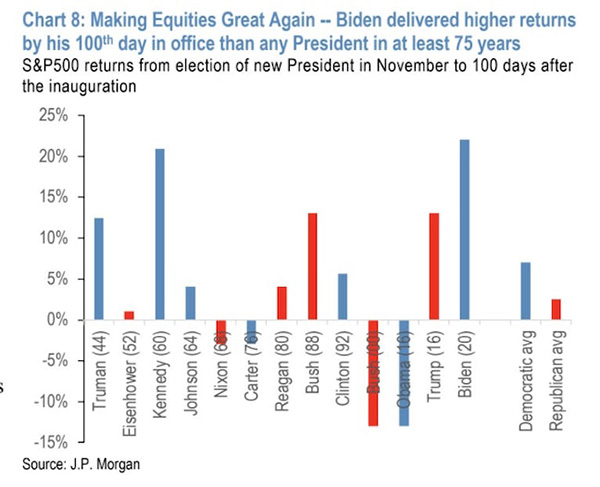
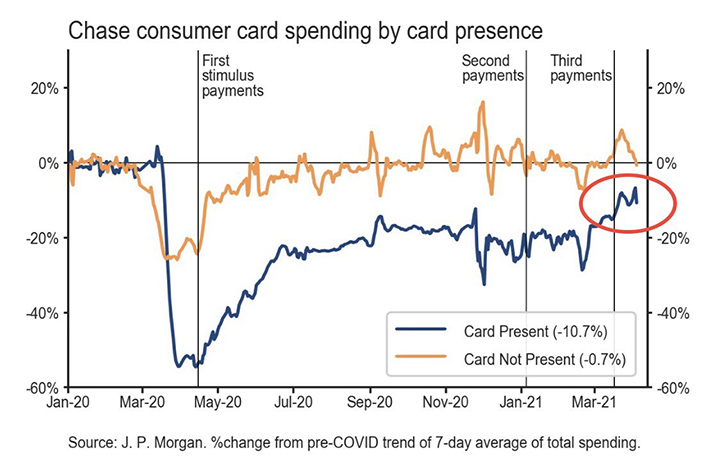
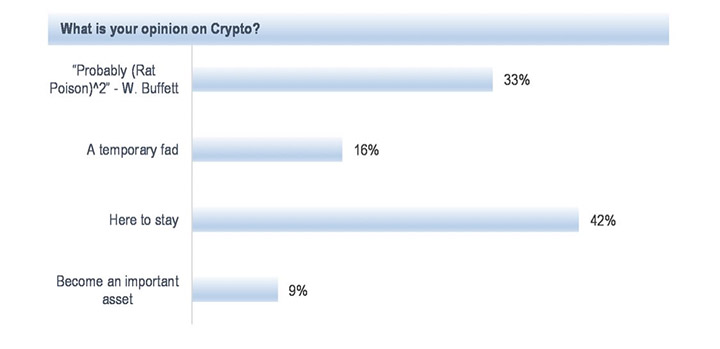
Then on Monday, the People’s Bank of China urged Alipay not to provide services related to cryptocurrency activities, including account openings, clearing or settlement. This move sent shockwaves through the cryptocurrency markets and thus, the price of cryptocurrencies has seen extreme volatility the last few weeks. As seen in the chart below from JP Morgan, the opinions on cryptocurrency’s long-term possibilities remain widely varied — which contributes to volatility, as different cryptocurrencies are used as trading vehicles, hedges against inflation and for pure speculation.
So, what can we learn from all this? Bitcoin and other cryptocurrencies are still relatively new, as they have been around for a little more than 10 years. They remain a very risky investment that may or may not pay off. Investors should invest only as much as they are willing to lose, and if one does invest, it should be part of a well-diversified portfolio.
From a portfolio perspective, we continue to adhere to the tried-and-true disciplines of diversification, periodic rebalancing and looking forward, while not making investment decisions based on where we have been. Making market decisions based on what might happen may be detrimental to long-term performance. The key is to stay invested and stick with the financial plan. Markets go up and down over time and downturns present opportunities to purchase stocks at a lower value.
It all starts with a solid financial plan for the long run that understands the level of risk that is acceptable for each client. Regarding investments, we believe in diversification and having different asset classes that allow you to stay invested. The best option is to stick with a broadly diversified portfolio that can help you to achieve your own specific financial goals — regardless of market volatility. Long-term fundamentals are what matter.
Sources: CNBC, DW.com, JP Morgan Chase

This material contains an assessment of the market and economic environment at a specific point in time and is not intended to be a forecast of future events, or a guarantee of future results. Forward-looking statements are subject to certain risks and uncertainties. Actual results, performance, or achievements may differ materially from those expressed or implied. Information is based on data gathered from what we believe are reliable sources.
Using diversification as part of your investment strategy neither assures nor guarantees better performance and cannot protect against loss of principal due to changing market conditions.
Past performance is not a guarantee of future results.
The opinions expressed in this commentary are those of the author and may not necessarily reflect those held by Kestra Investment Services, LLC or Kestra Advisory Services, LLC. This is for general information only and is not intended to provide specific investment advice or recommendations for any individual. It is suggested that you consult your financial professional, attorney, or tax advisor with regard to your individual situation.
Securities offered through Kestra Investment Services, LLC (Kestra IS), member FINRA/SIPC. Investment Advisory Services offered through Kestra Advisory Services, LLC (Kestra AS) an affiliate of Kestra IS. Kestra IS and Kestra AS are not affiliated with CD Wealth Management. Investor Disclosures: https://bit.ly/KF-Disclosures