Timing the market is extremely difficult – even during the best of times and for the top traders on Wall Street. A recent study by Bank of America shows that if an investor missed the S&P 500’s 10 best days each decade going back to 1930, the total return for the entire 80+ years would be 28%. On the other hand, if that same person had stayed invested, the total return would have been 17,715%!
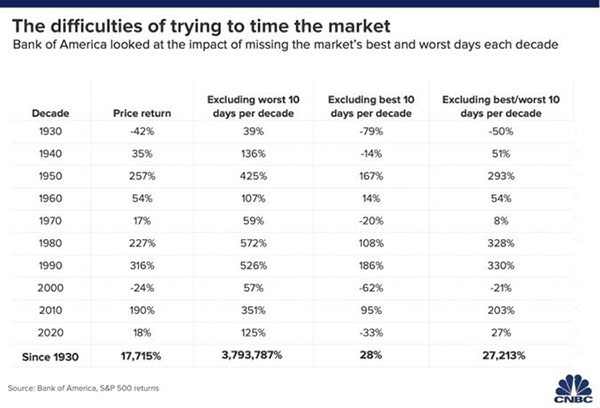
When stock markets have a sell-off, the natural impulse for many investors is to hit the sell button. However, the best market days, in regard to performance, often follow the biggest drops. If you follow your impulse to sell, your returns could end up closer to 28% over 80 years versus the much larger return from staying invested through both good and bad days.
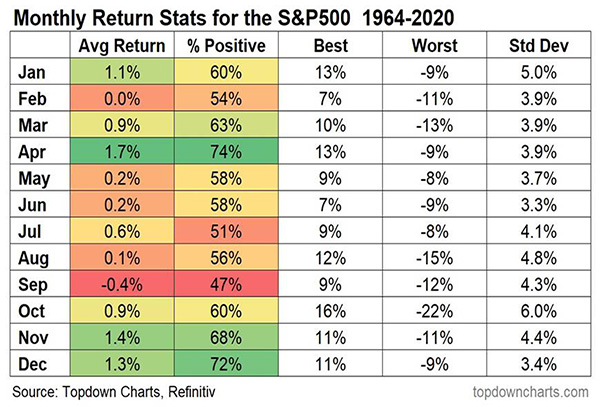
As the chart below shows, April has historically been one of the best months for the stock market since 1964. The average monthly return has been 1.7%, and the market has been positive almost 75% of the time. More importantly, every month except for September has had positive return more than 50% of the time over the last 56 years.
So, what can we learn from all this? Markets go up and down over time. The key is to stay invested and stick with the financial plan. Market downturns present opportunities to purchase stocks that were previously viewed as overvalued. In a down market, you are “buying low,” one of the fundamental tenets of investing.
Given the difficulty of timing the market, the most realistic strategy for a majority of investors is to invest and stay invested over time. Procrastination, or not investing, is worse than bad timing. We continue to view more risk being out of the market than in the market. Riding out future market volatility, in addition to having a diversified portfolio, means staying the course. From an investment perspective, we use trends to help with the strategic and tactical asset allocation and where we see the portfolio heading over the next 5-7 years with short-term adjustments along the way.
It all starts with a solid financial plan for the long run that understands the level of risk that is acceptable for each client. With regards to investments, we believe in diversification and having different asset classes that allow you to stay invested. The best option is to stick with a broadly diversified portfolio that can help you to achieve your own specific financial goals — regardless of market volatility. Long-term fundamentals are what matter.

Sources: CNBC, Topdowncharts
This material contains an assessment of the market and economic environment at a specific point in time and is not intended to be a forecast of future events, or a guarantee of future results. Forward-looking statements are subject to certain risks and uncertainties. Actual results, performance, or achievements may differ materially from those expressed or implied. Information is based on data gathered from what we believe are reliable sources.
Using diversification as part of your investment strategy neither assures nor guarantees better performance and cannot protect against loss of principal due to changing market conditions.
Past performance is not a guarantee of future results.
The opinions expressed in this commentary are those of the author and may not necessarily reflect those held by Kestra Investment Services, LLC or Kestra Advisory Services, LLC. This is for general information only and is not intended to provide specific investment advice or recommendations for any individual. It is suggested that you consult your financial professional, attorney, or tax advisor with regard to your individual situation.
Securities offered through Kestra Investment Services, LLC (Kestra IS), member FINRA/SIPC. Investment Advisory Services offered through Kestra Advisory Services, LLC (Kestra AS) an affiliate of Kestra IS. Kestra IS and Kestra AS are not affiliated with CD Wealth Management. Investor Disclosures: https://bit.ly/KF-Disclosures