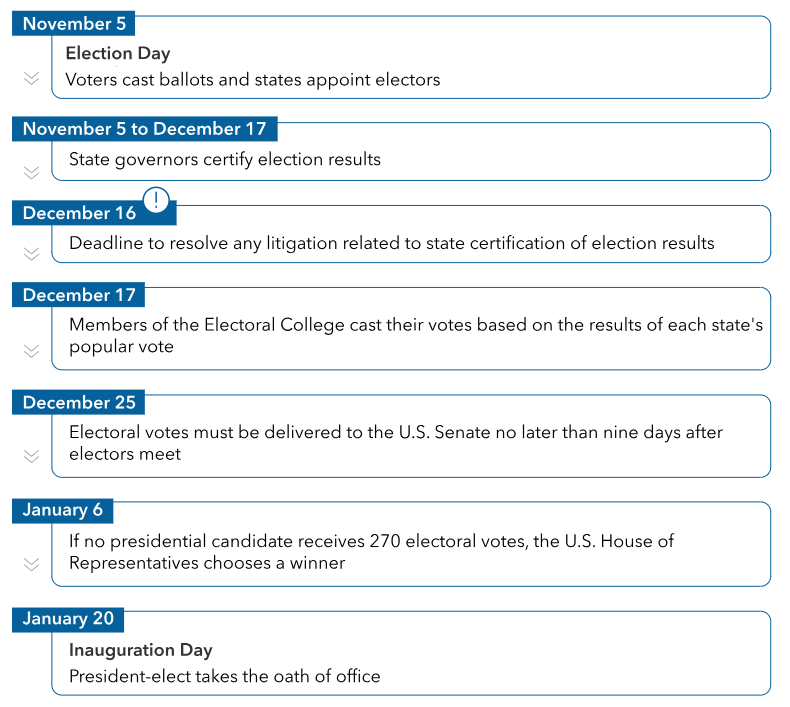
With the election in the rearview mirror, we are entering the home stretch for 2024. The end of the year is an important time for making financial decisions that can have an impact not only in the new year ahead, but for years to come.
As 2025 approaches, now is the perfect time to review planning strategies to ensure that your wealth plan reflects any changes in your circumstances or goals, the current tax environment and the economic landscape.
We recommend that you review the checklist below for ideas to consider and discuss.
Income Tax Strategies
1. If you anticipate your marginal income tax bracket to increase next year, you may consider accelerating income into 2024 and deferring deductions to 2025.
2. If you anticipate being in a lower tax bracket next year:
• Defer income (if possible) to postpone paying the tax and to have that income at a lower bracket.
• If you itemize on your tax return, bunch your medical expenses in the current year to meet the percentage of your adjusted gross income to claim those deductions.
• Make your January mortgage payment in December so you can deduct the interest on this year’s return.
Tax-related Investment Strategies
1. Tax-loss harvesting is the strategy of selling securities at a loss to offset a capital gain liability, either for today or in the future. Securities must be sold by Dec. 31, the last trading day of 2024, to realize a capital gain or loss.
• Harvest losses by selling taxable investments. Note: You must wait at least 31 days before buying back a holding that is sold for a loss to avoid the IRS wash-sale rule.
• Harvest gains by selling taxable investments if you have a tax loss carryforward.
2. Ensure that you have satisfied your required minimum distributions (RMD).
• If you fail to take your RMD, this may result in a 25% penalty (down from 50%).
• If you own an inherited IRA, an RMD may be required separately for that account as well. If you inherited an IRA after 2019, the inherited IRA must be depleted by the end of the 10th year. Beginning next year, certain beneficiaries must take an annual distribution over the 10-year period following inheritance, instead of waiting to distribute the entire amount until the 10th year.
Retirement Planning Strategies
1. Maximize your IRA contributions. You may be able to deduct annual contributions of up to $7,000 to your traditional IRA and $7,000 to your spouse’s IRA ($8,000 if over the age of 50).
2. Consider increasing or maximizing your 401(k) contribution. The maximum contribution in 2024 for those under 50 is $23,000, and for those over 50, the maximum contribution is $30,500. Boosting contributions to your 401(k) can lower your adjusted gross income while increasing your retirement savings.
3. Consider making contributions to a Roth 401(k) if your plan allows.
4. Consider setting up a Roth IRA for each of your children who have earned income during the year.
Gifting Strategies
1. Consider making gifts of up to $18,000 per person as allowed under the federal annual gift tax exclusion. You can give up to $18,000 this year to as many people as you want without triggering gift taxes. Payments made directly to educational and/or medical institutions on behalf of your intended beneficiary do not count towards your annual exclusion amount — or against your lifetime estate tax exclusion.
2. Create a donor advised fund for an immediate income tax deduction and provide immediate and future benefits to charity over time.
3. If you already have a donor advised fund or want to donate to a charity, consider gifting appreciated assets that have been held longer than one year to get the fair market value income tax deduction while avoiding income tax on the appreciation.
4. If you are over the age of 70½, consider making a direct transfer from an IRA to a public charity. The distribution is excluded from gross income, and you can give up to $105,000 as a tax-free gift from your IRA that may fully satisfy RMD requirements.
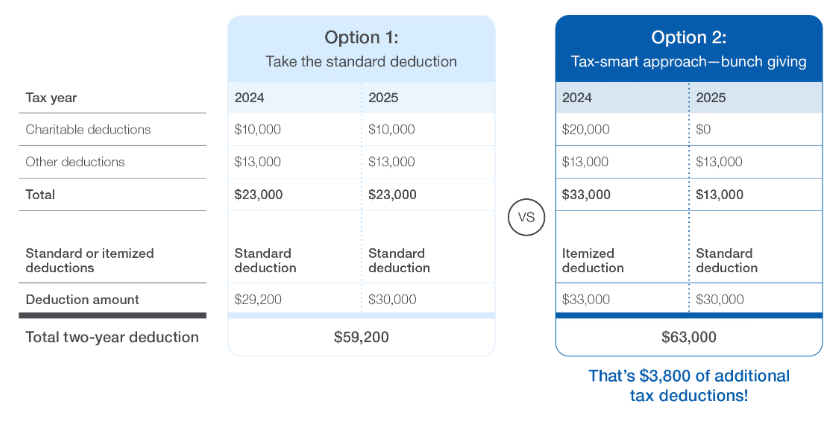
5. Consider combining multiple years of charitable giving into a single year to exceed the standard deduction threshold. This is called “bunching.” The chart below illustrates how it can reduce taxes if executed properly.
Wrapping Up 2024, Planning for 2025
1. Discuss major life events with your team at CD Wealth to confirm you have clarity in your current situation.
2. Communicate with your CPA to provide capital gains and investment income information for a more accurate year-end projection.
3. Check your Health Savings Account (HSA) contributions for 2025. If you qualify, you can contribute up to $4,300 (individual) or $8,550 (family), plus an additional $1,000 catch-up if you are over 55.
4. Double-check your beneficiary designations for retirement plans, IRAs, Roth IRAs, annuities and life insurance policies.
5. If you do not already have identity theft protection, consider purchasing a service to help protect you and your family.
The end of the year is the perfect time to review your financial planning needs.
This includes reviewing the investment portfolio, assessing year-end tax planning opportunities, reviewing retirement goals, and managing your legacy plans.
The checklist above includes just some of the items that may apply to you and your family. We are happy to meet with you to discuss any of the above and to ensure that you stay on track with your financial goals.

The CD Wealth Formula
We help our clients reach and maintain financial stability by following a specific plan, catered to each client.
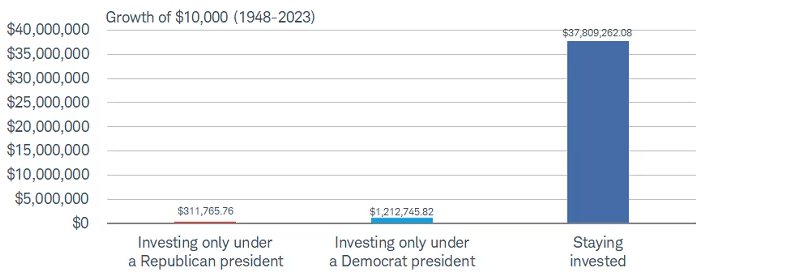
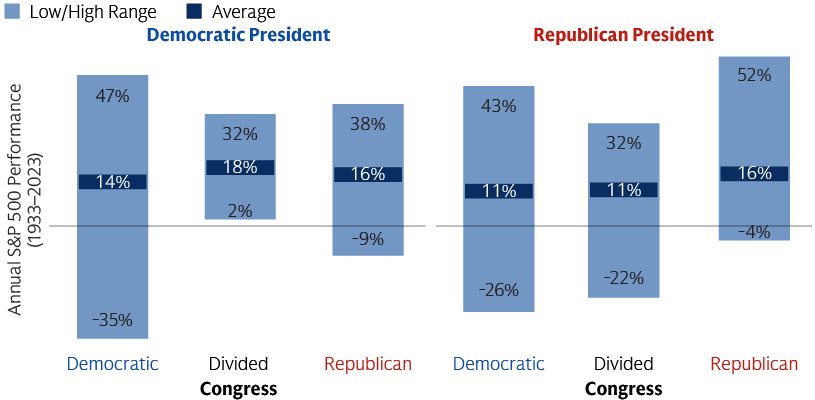
Our focus remains on long-term investing with a strategic allocation while maintaining a tactical approach. Our decisions to make changes are calculated and well thought out, looking at where we see the economy is heading. We are not guessing or market timing. We are anticipating and moving to those areas of strength in the economy — and in the stock market.
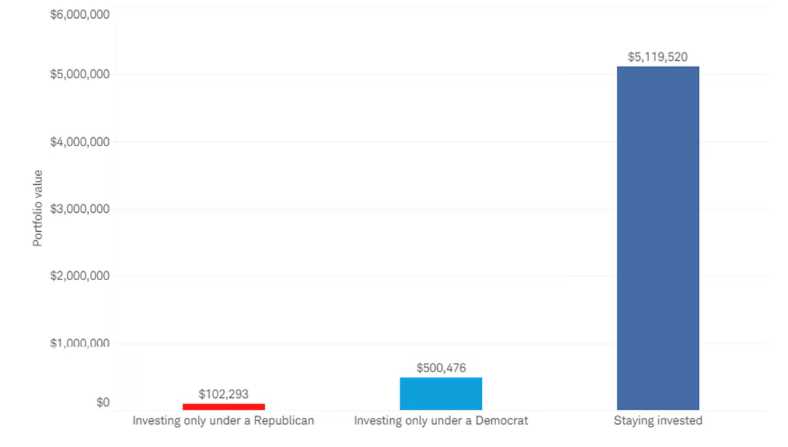
We will continue to focus on the fact that what really matters right now is time in the market, not out of the market. That means staying the course and continuing to invest, even when the markets dip, to take advantage of potential market upturns. We continue to adhere to the tried-and-true disciplines of diversification, periodic rebalancing and looking forward, while not making investment decisions based on where we have been.
It is important to focus on the long-term goal, not on one specific data point or indicator. Long-term fundamentals are what matter. In markets and moments like these, it is essential to stick to the financial plan. Investing is about following a disciplined process over time.
Sources: Capital Group, Fidelity, Schwab