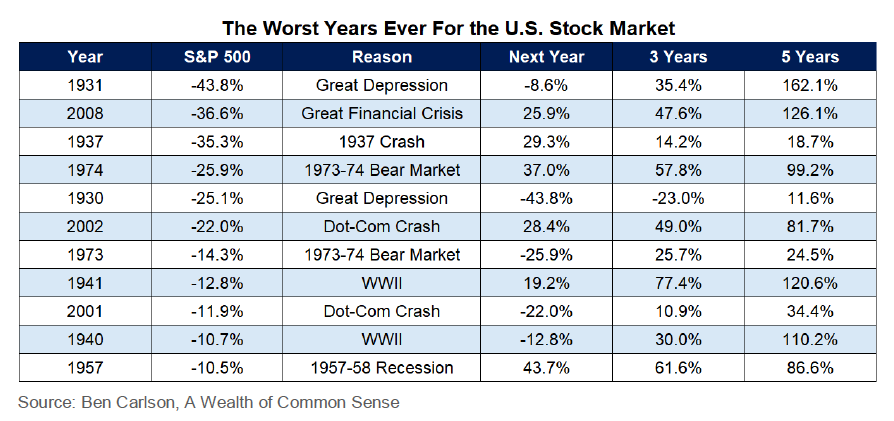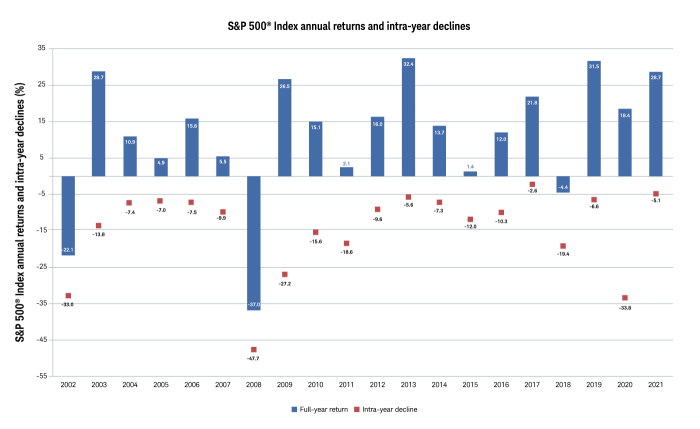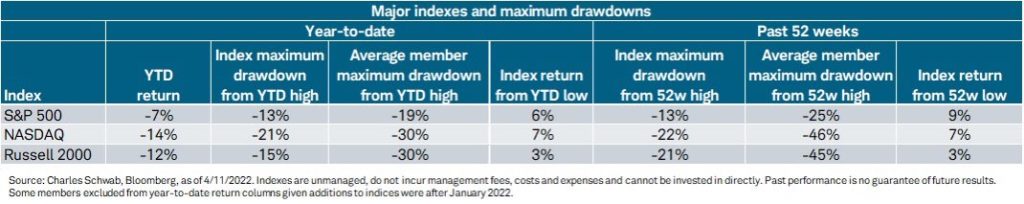
The U.S. economy and the stock market struggled mightily in the first half of 2022, and the S&P 500 had its worst start in 52 years. Inflation levels not seen since the 1980s — combined with aggressive monetary policy by the Federal Reserve, the effects of the Russia/Ukraine war and continued COVID lockdowns in China — sent the S&P 500 into a bear market. While the S&P 500 officially crossed into a bear market in mid-June, many of the underlying stock holdings had been in a bear market for a while, which is similar with the Russell 2000 and the NASDAQ as well.
The market attempted several rallies during the first half of the year, but aggressive Fed policy and the removal of liquidity from the stock market kept pressure on stocks. As a result of the pandemic, the Federal Reserve and Congress added trillions of dollars to the economy in the last few years. The Fed began aggressive interest rate hikes and stopped bond purchases to remove excess liquidity from the economy and slow down inflation. Fears of a recession have intensified, and more companies are lowering earnings guidance for the second half of the year.
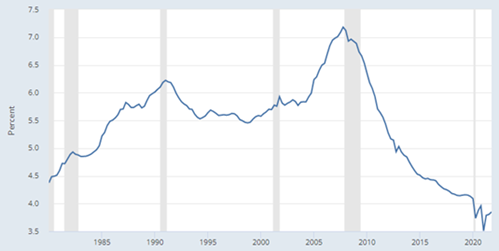
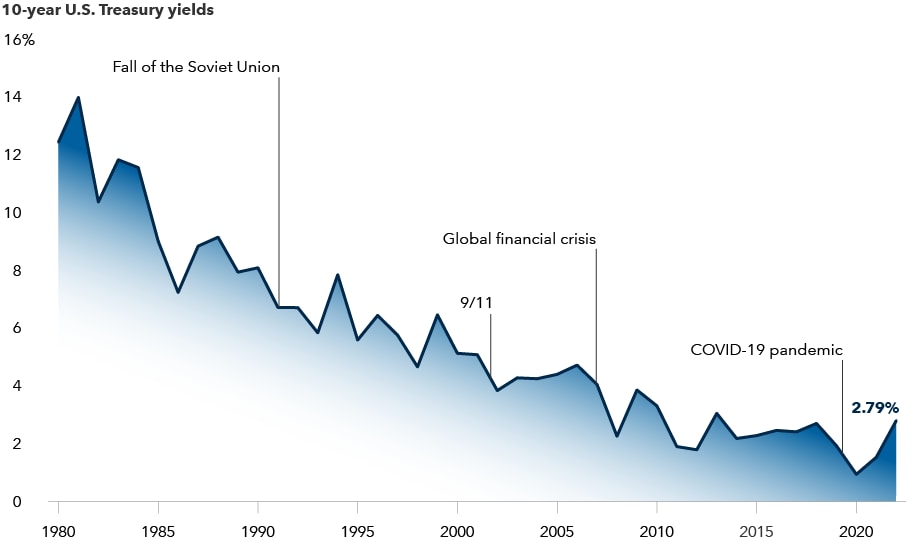
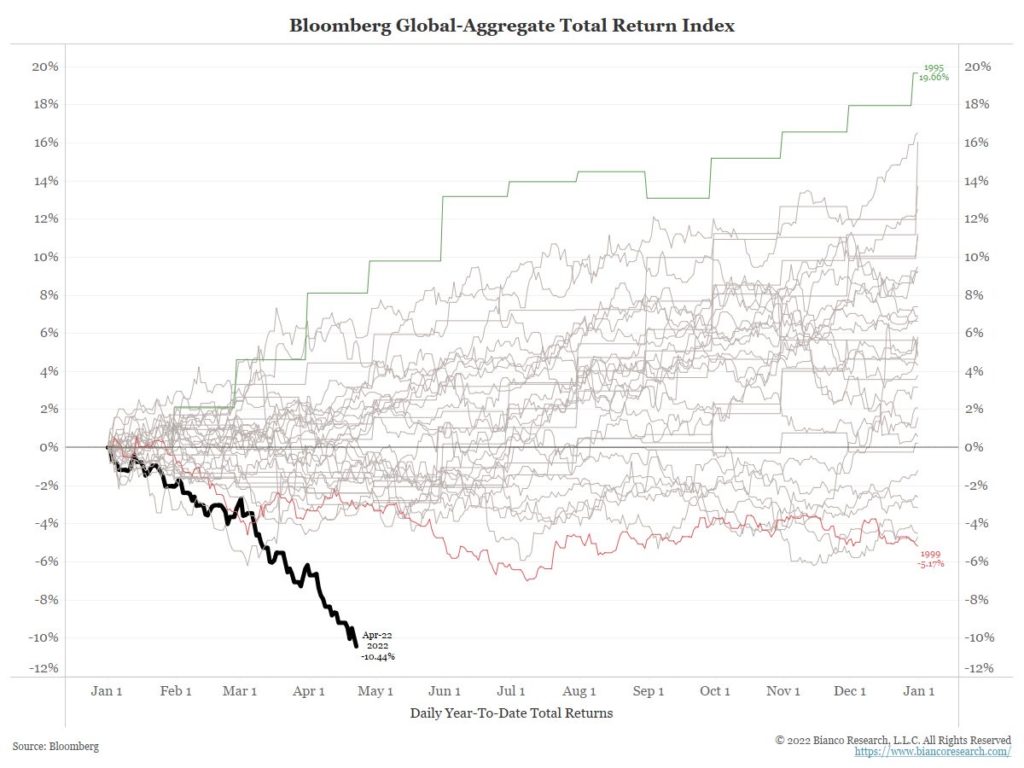
The bond market also had a difficult six months. Inflation spiked higher than anticipated, and rates rose more rapidly than the market expected. Bonds were down almost 10% for the first half of the year. As the economy continues to show signs of slowing down, with a potential recession on the horizon, the 10-year Treasury yield has decreased to under 3%. The bond market is showing signs that the Federal Reserve may have to slow down the rate of increase and potentially even reduce interest rates in 2023.
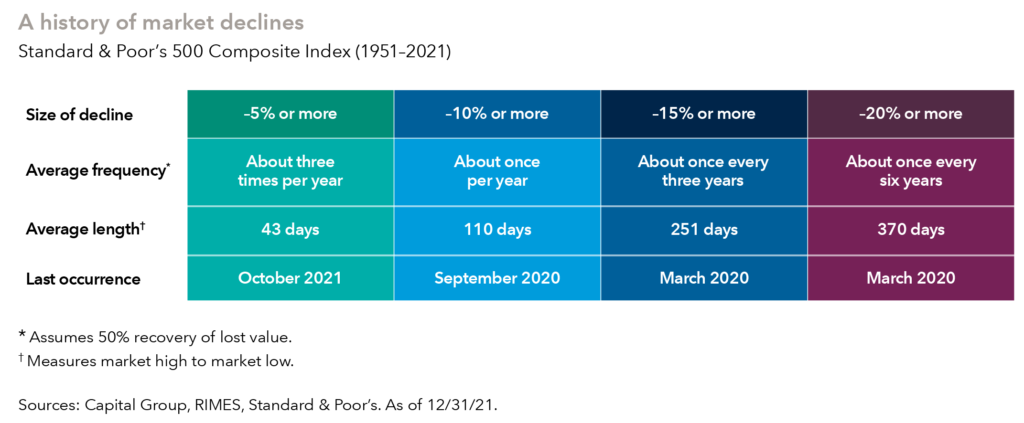
We do not know when the bear market will come to an end, but we do know that it will come to an end.
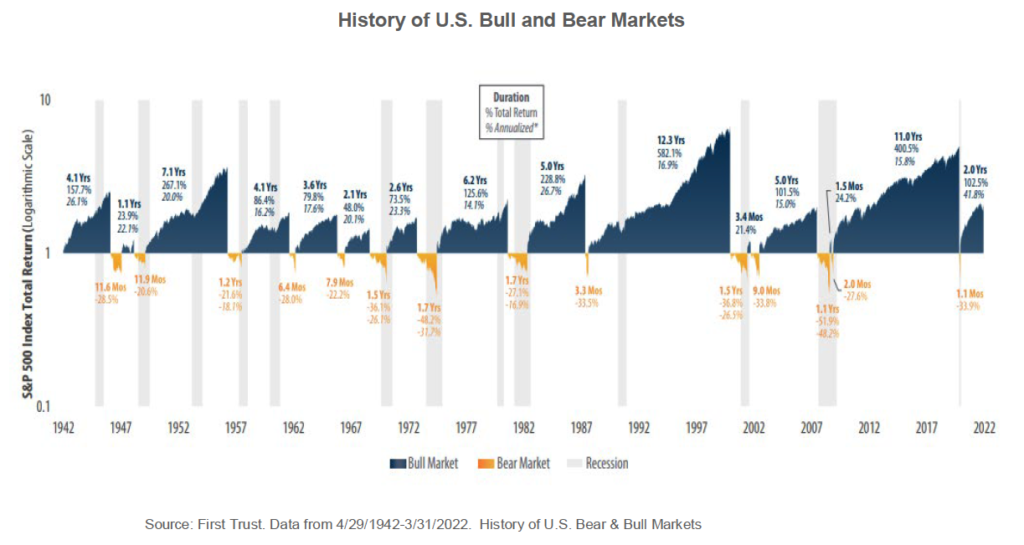
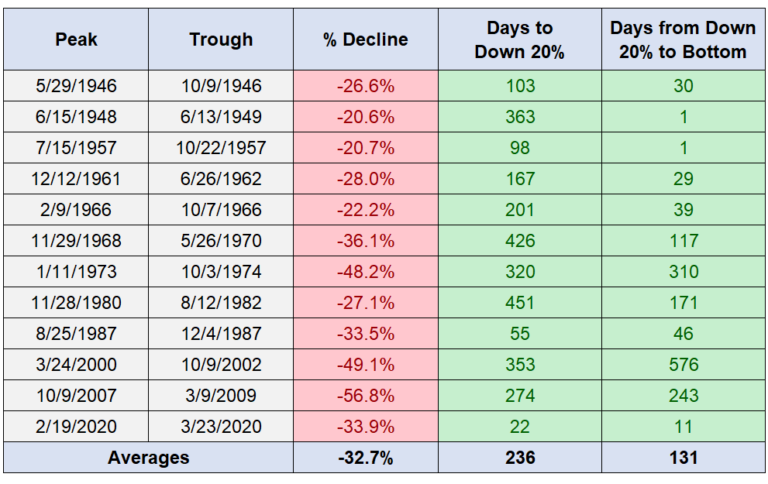
As we recently wrote, the average bear market since 1929 has lasted 9½ months. Going back to World War II, the average bear market has lasted 12 months, and it has taken 21 months on average to break even after a bear market. The chart below shows the peaks and troughs of every bear market since WWII. On average, it has taken much longer to reach 20% losses than it takes to reach a bottom. Seven out of the last 12 bear markets have bottomed in 46 days or less, once the 20% barrier was breached.
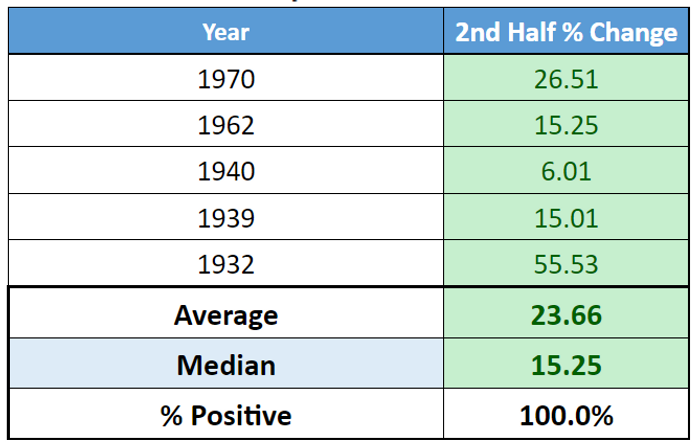
The chart below shows how the S&P 500 bounced back after first-half falls of 15% or more. The sample size is small, however, with only five instances going back to 1932. The S&P 500 did rise in each of these instances, with an average return of 23.66% and a median rise of 15.25%.
S&P 500 second-half performance after a first-half fall of 15% or more
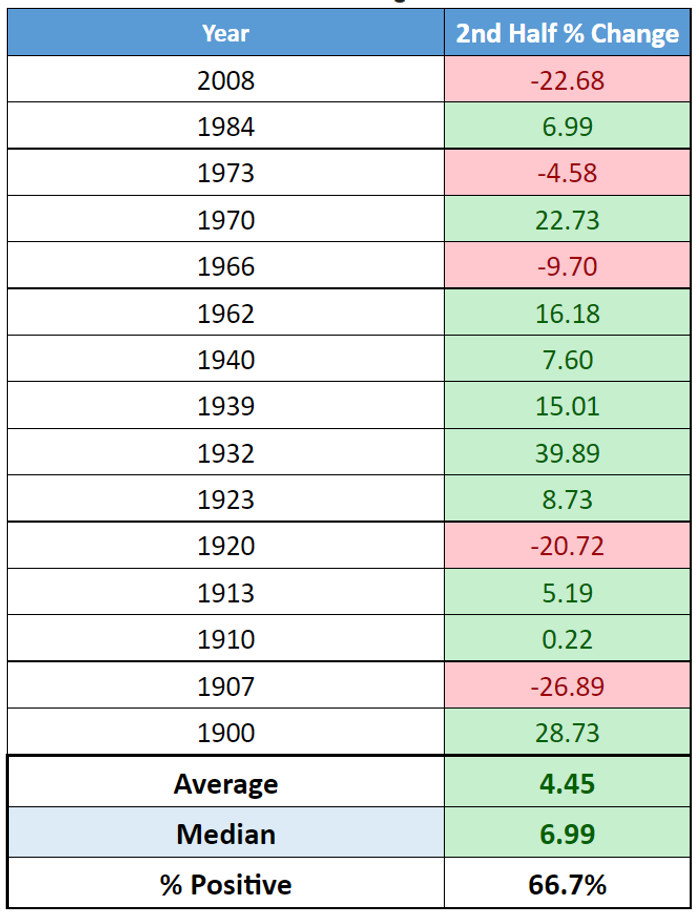
Looking at the Dow Jones Index provides a larger sample size. The Dow Jones has had 15 instances of first-half declines of greater than 10%. The Dow was down almost 15% for the first half of the year, its largest decline since 2008. More than two-thirds of the time, the Dow rallied in the second half of the year for an average return of 4.45% and a median return of almost 7%.
DJIA second-half performance after 10% fall in first half
Please remember that past results do not guarantee future returns. Time will tell how the market responds to the current bear market. The charts above provide some great context for staying invested and hope that positive market returns may be around the corner.
So, what can we learn from all this? For the second half of 2022, we anticipate volatility to remain in both the equity and fixed-income markets. Our plan is to remain invested, take advantage of the markets being down by tax loss harvesting, and as always, to make the necessary tweaks to the portfolio as the economy continues to change. It appears more evident that the U.S. is headed towards a recession. GDP is likely to show two straight quarters of negative growth, a traditional sign that the economy is in a recession. Remember, though, that the stock market is a leading indicator and is already projecting that the economy is softening. Once the economy is in an official recession, the market is forward-looking and heading towards a recovery.
We will continue to focus on the fact that what really matters right now is time in the market, not out of the market. That means staying the course and continuing to invest, even when the markets dip, to take advantage of potential market upturns. We continue to adhere to the tried-and-true disciplines of diversification, periodic rebalancing and looking forward, while not making investment decisions based on where we have been. It is important to focus on the long-term goal, not on one specific data point or indicator.
In markets and moments like these, it is essential to stick to the financial plan. Investing is about following a disciplined process over time.
At the end of the day, investors will be well-served to remove emotion from their investment decisions and remember that over time, markets tend to rise. During volatile markets, it is important to remember that the fear of losing money is stronger than the joy of making money. Investor emotions can have a big impact on retirement outcomes. Market corrections and bear markets are normal; nothing goes up in a straight line. Making market decisions based on what might happen may be detrimental to long-term performance. The key is to stay invested and stick with the financial plan. Markets go up and down over time, and downturns present opportunities to purchase stocks at a lower value.
It all starts with a solid financial plan for the long run that understands the level of risk that is acceptable for each client. Regarding investments, we believe in diversification and having different asset classes that allow you to stay invested. The best option is to stick with a broadly diversified portfolio that can help you to achieve your own specific financial goals — regardless of market volatility. Long-term fundamentals are what matter.
Sources: Ben Carlson, Dow Jones Data, Schwab

This material contains an assessment of the market and economic environment at a specific point in time and is not intended to be a forecast of future events, or a guarantee of future results. Forward-looking statements are subject to certain risks and uncertainties. Actual results, performance, or achievements may differ materially from those expressed or implied. Information is based on data gathered from what we believe are reliable sources.
Using diversification as part of your investment strategy neither assures nor guarantees better performance and cannot protect against loss of principal due to changing market conditions.
Past performance is not a guarantee of future results.
The opinions expressed in this commentary are those of the author and may not necessarily reflect those held by Kestra Investment Services, LLC or Kestra Advisory Services, LLC. This is for general information only and is not intended to provide specific investment advice or recommendations for any individual. It is suggested that you consult your financial professional, attorney, or tax advisor with regard to your individual situation.
Securities offered through Kestra Investment Services, LLC (Kestra IS), member FINRA/SIPC. Investment Advisory Services offered through Kestra Advisory Services, LLC (Kestra AS) an affiliate of Kestra IS. CD Wealth Management and Bluespring Wealth Partners LLC* are affiliates of Kestra IS and Kestra AS. Investor Disclosures: https://bit.ly/KF-Disclosures
*Bluespring Wealth Partners, LLC acquires and supports high quality investment adviser and wealth management companies throughout the United States.