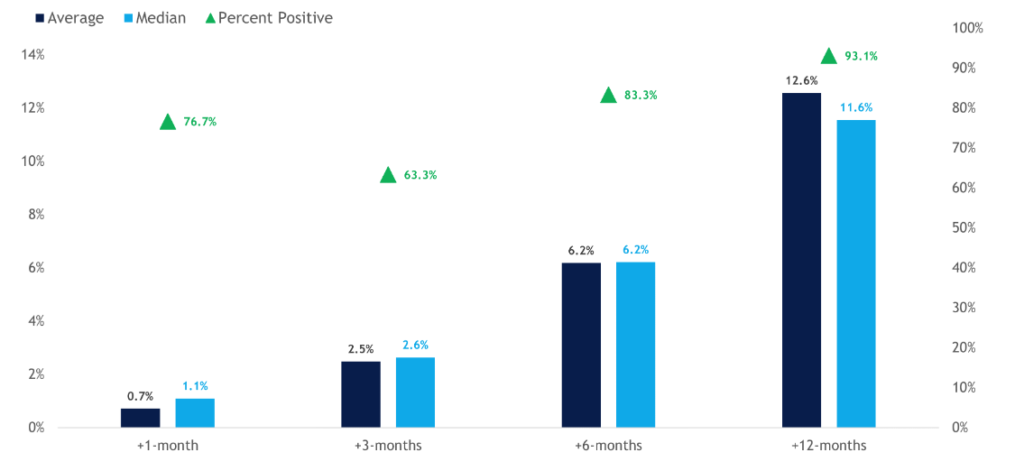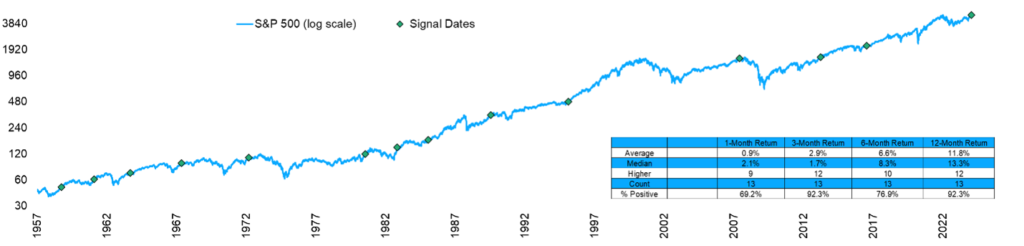
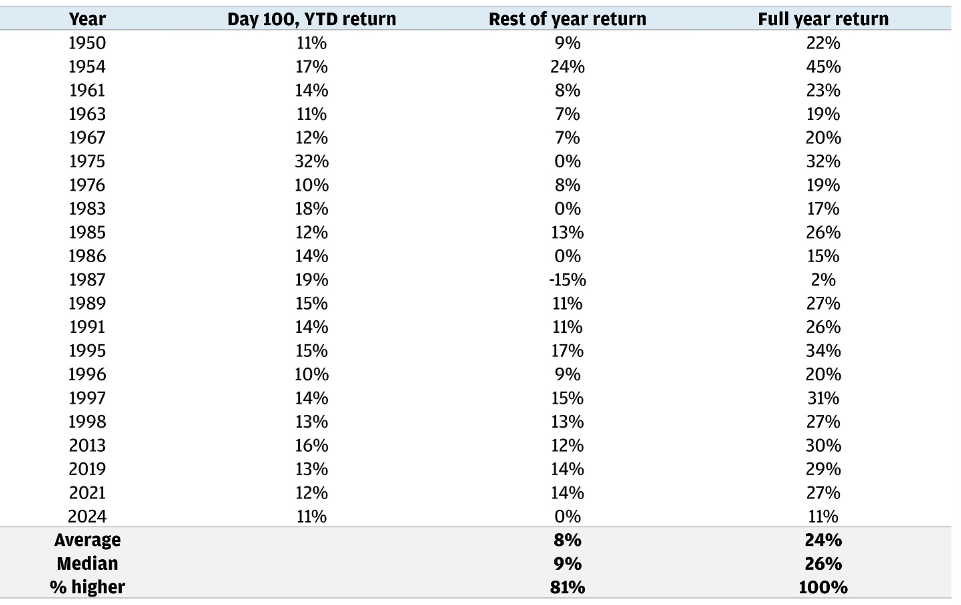
We are more than 100 trading days into the year, and the S&P 500 is up over 10% for the year. Since 1950, whenever the S&P 500 has gained at least 10% in the first 100 trading days, stocks have closed out the full year with an average return of about 25%.
At this time last year, the S&P 500 was up over 8% and closed out the year with a gain of almost 25%. So far, 2024 has seen more than 25 record highs. During years in which the S&P 500 reaches a new high, it usually makes around 30 new highs on average. During years when there have been this many new highs this early in the year, the full year has typically made more than 50 new highs.
100 Days In: Strong Returns Tend to Signal More Strength Ahead
S&P 500 returns after a 10% rally 100 trading days into the year
The month of May finished strong, with the S&P 500 up almost 5%, erasing the April market swoon. S&P 500 companies are enjoying their best earnings season in almost two years, growing profits 6% over the prior year. Every sector but healthcare had positive earnings growth.
Even more important is that profit margins (how much profit a company makes from each dollar of sales) are around 12% for the quarter. Strong earnings growth is good for stocks and helps support the rising prices we have seen to start the year.
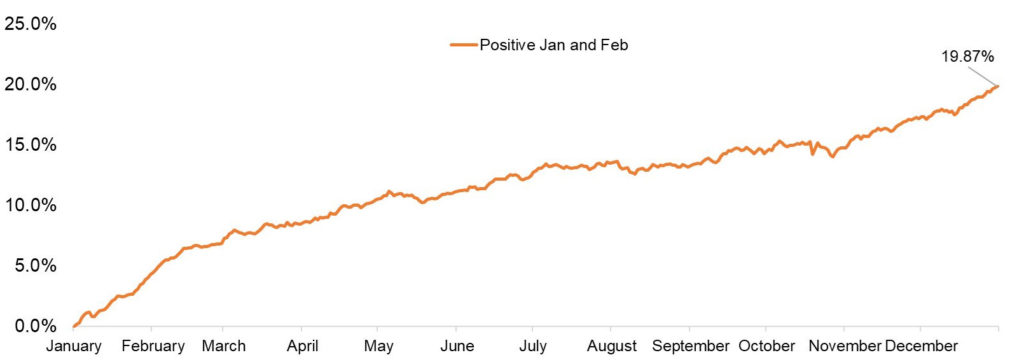
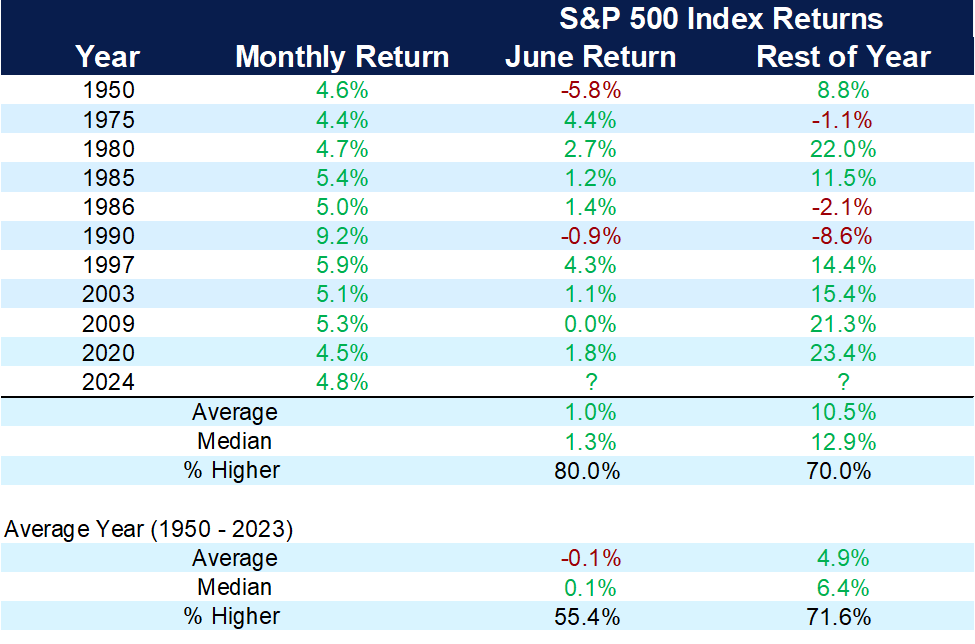
The chart below shows how the market has fared following a strong May going back to 1950. This is the 11th time since 1950 that May was up over 4%, and in those occurrences, the average return for the rest of the year has been over 10%.
A Big May Could Have Bulls Smiling
S&P 500 after >4% gain in May
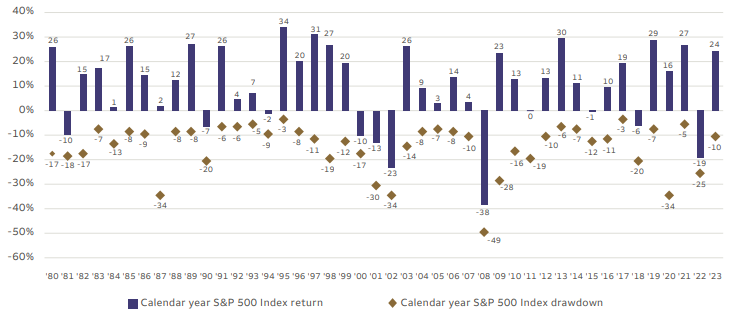
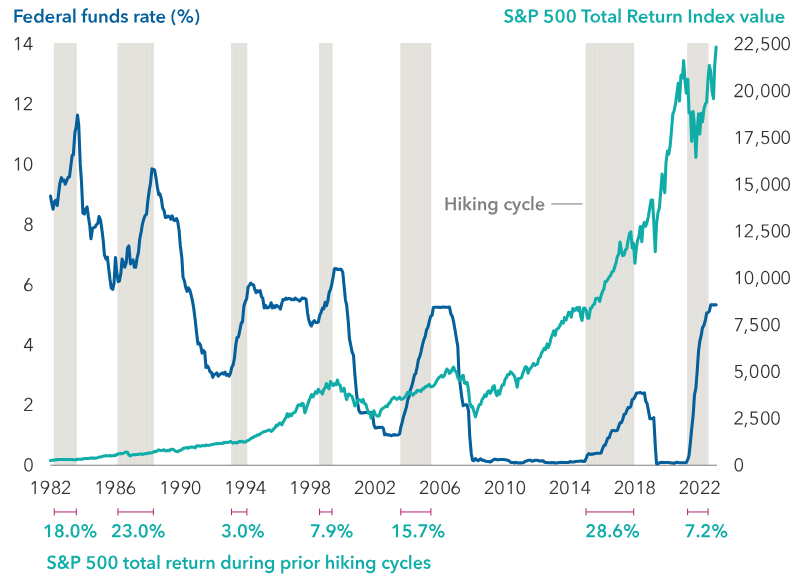
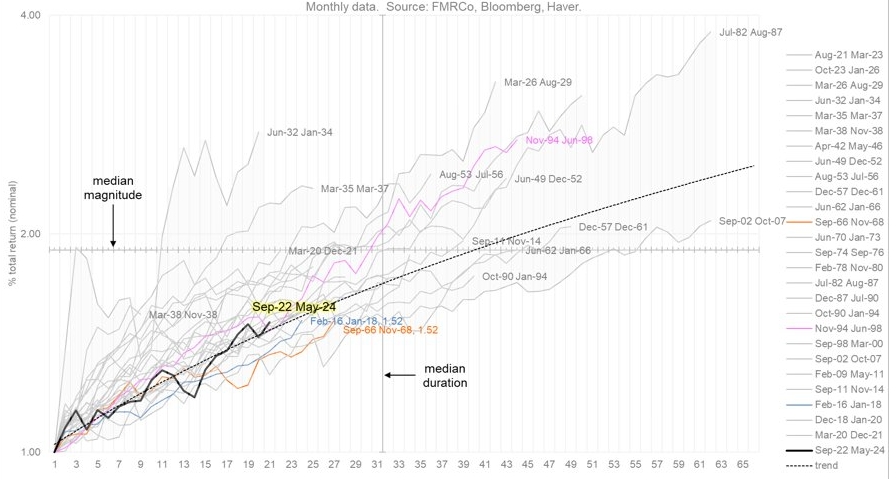
The current bull market cycle is 20 months old and has produced a 53% gain. By historical standards, the median bull market cycle has been 30 months and produced 90% gains over the past 100 years.
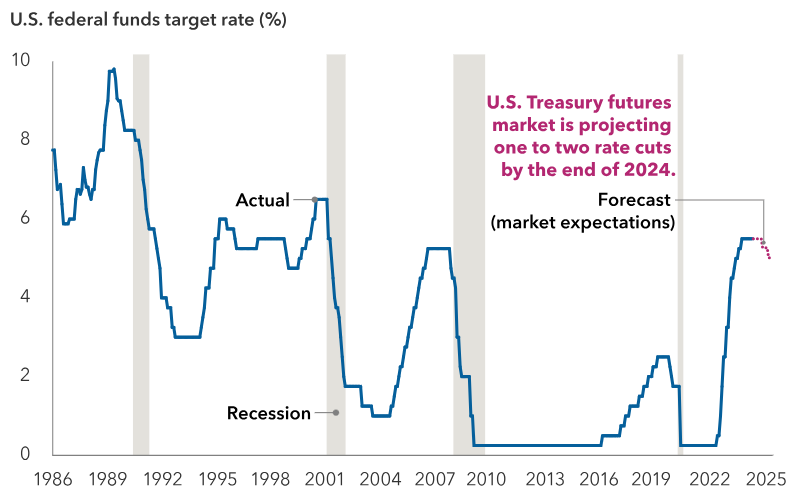
It is understandable to worry about the strength of the market following the run that we have had over the last 19 months. Remember, this market rally has happened with higher rates and sticky inflation. If the Fed were to reduce rates, that would be considered another positive for the market in the second half of the year.
Cyclical Bull Markets
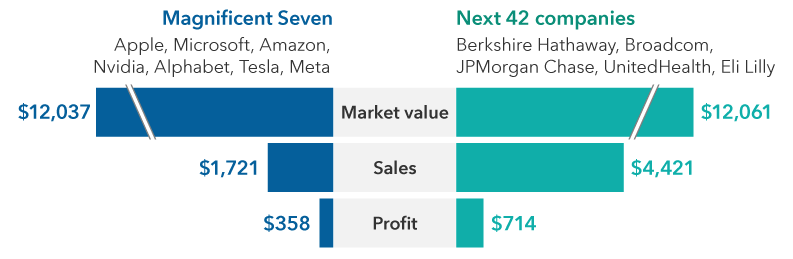
The strong market in the last few years has led to a growth in net worth for those who were invested in the stock market. The Magnificent Seven stocks have continued to lead the market higher, driven by advancements in artificial intelligence. Many positives will come from AI’s growth, but at the same time, financial scams using AI tools and sophisticated technology are making things harder on consumers.
Financial crimes are on their way up and may be at a crisis level. Scams may come in the form of a text or email you receive that is purported to be from Apple, Amazon or PayPal — or even from someone you know who has a can’t-miss investment idea.
Here are four financial scams to be aware of in 2024:
1. Grandparent scam: This scam targets people by suggesting that a family member is in immediate jeopardy. Such scams are becoming more sophisticated with advanced technology, as thieves can capture a voice recording and generate an imitation version of your voice. Remember: Do not answer unknown calls, allowing someone to capture a recording of your voice.
2. Romance scam: An increasingly common way people take money from others involves creating a false online relationship and conning the other person into giving them money. A new version of this scam includes conning the fake romantic interest into investing in cryptocurrency or sending with gift cards.
3. Cryptocurrency scam: This is now the most common type of scam with total losses of more than $4 billion.
4. Employment scams: In this scam, a fake employer sends you an email or text to gather information and obtain your personal identity. Do not click on the link from an unexpected text about a job opportunity.
Remember, you can’t be too careful today when it comes to protecting your identity and your data. Artificial intelligence will continue to evolve and make the battle more challenging.
If you do get caught in a scam, don’t be ashamed. Act on it by reporting it to your family, you financial advisor, your banks and the AARP. The faster you address the issue, the faster you can get it resolved.
We are a safe spot for you and your family if you feel like you have been scammed. Call your team at CD Wealth right away, and we will help guide you.
The CD Wealth Formula
We help our clients reach and maintain financial stability by following a specific plan, catered to each client.
Our focus remains on long-term investing with a strategic allocation while maintaining a tactical approach. Our decisions to make changes are calculated and well thought out, looking at where we see the economy is heading. We are not guessing or market timing. We are anticipating and moving to those areas of strength in the economy — and in the stock market.
We will continue to focus on the fact that what really matters right now is time in the market, not out of the market. That means staying the course and continuing to invest, even when the markets dip, to take advantage of potential market upturns. We continue to adhere to the tried-and-true disciplines of diversification, periodic rebalancing and looking forward, while not making investment decisions based on where we have been.
It is important to focus on the long-term goal, not on one specific data point or indicator. Long-term fundamentals are what matter. In markets and moments like these, it is essential to stick to the financial plan. Investing is about following a disciplined process over time.
Sources: Carson, CNBC, Fidelity, JP Morgan

This material contains an assessment of the market and economic environment at a specific point in time and is not intended to be a forecast of future events, or a guarantee of future results. Forward-looking statements are subject to certain risks and uncertainties. Actual results, performance, or achievements may differ materially from those expressed or implied. Information is based on data gathered from what we believe are reliable sources.
Using diversification as part of your investment strategy neither assures nor guarantees better performance and cannot protect against loss of principal due to changing market conditions.
Past performance is not a guarantee of future results.
The opinions expressed in this commentary are those of the author and may not necessarily reflect those held by Kestra Investment Services, LLC or Kestra Advisory Services, LLC. This is for general information only and is not intended to provide specific investment advice or recommendations for any individual. It is suggested that you consult your financial professional, attorney, or tax advisor with regard to your individual situation.
Securities offered through Kestra Investment Services, LLC (Kestra IS), member FINRA/SIPC. Investment Advisory Services offered through Kestra Advisory Services, LLC (Kestra AS) an affiliate of Kestra IS. CD Wealth Management and Bluespring Wealth Partners LLC* are affiliates of Kestra IS and Kestra AS. Investor Disclosures: https://bit.ly/KF-Disclosures
*Bluespring Wealth Partners, LLC acquires and supports high quality investment adviser and wealth management companies throughout the United States.
Fidelity Investments and Fidelity Institutional® (together “Fidelity”) is an independent company, unaffiliated with Kestra Financial or CD Wealth Management. Fidelity is a service provider to both. There is no form of legal partnership, agency affiliation, or similar relationship between your financial advisor and Fidelity, nor is such a relationship created or implied by the information herein. Fidelity has not been involved with the preparation of the content supplied by CD Wealth Management and does not guarantee, or assume any responsibility for, its content. Fidelity Investments is a registered service mark of FMR LLC. Fidelity Institutional provides clearing, custody, or other brokerage services through National Financial Services LLC or Fidelity Brokerage Services LLC, Members NYSE, SIPC.