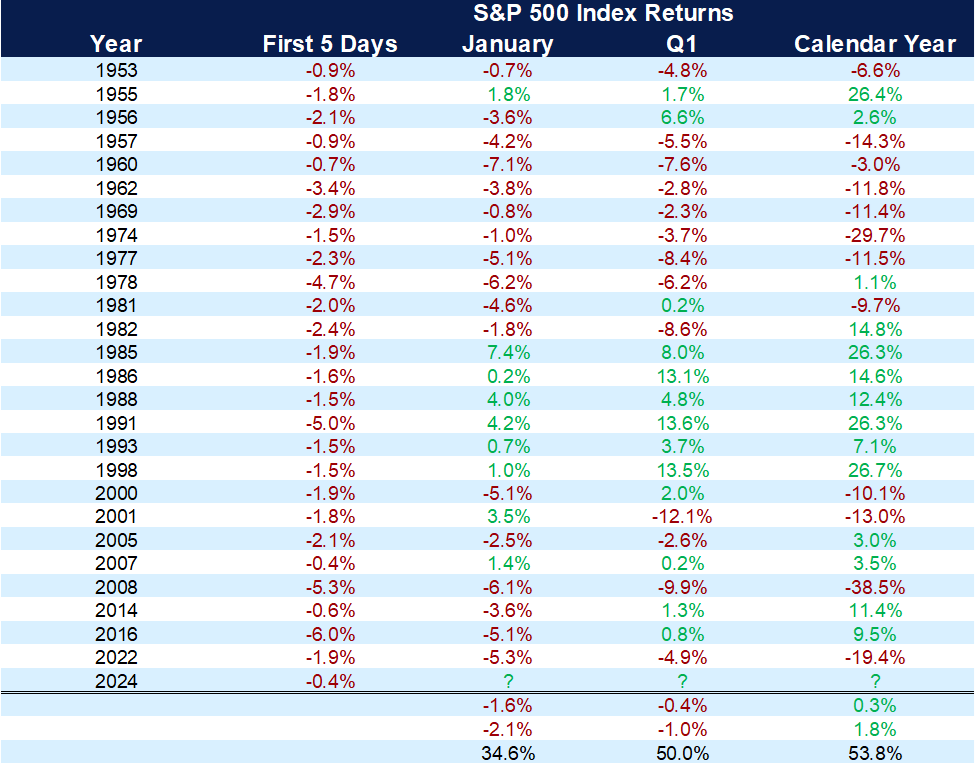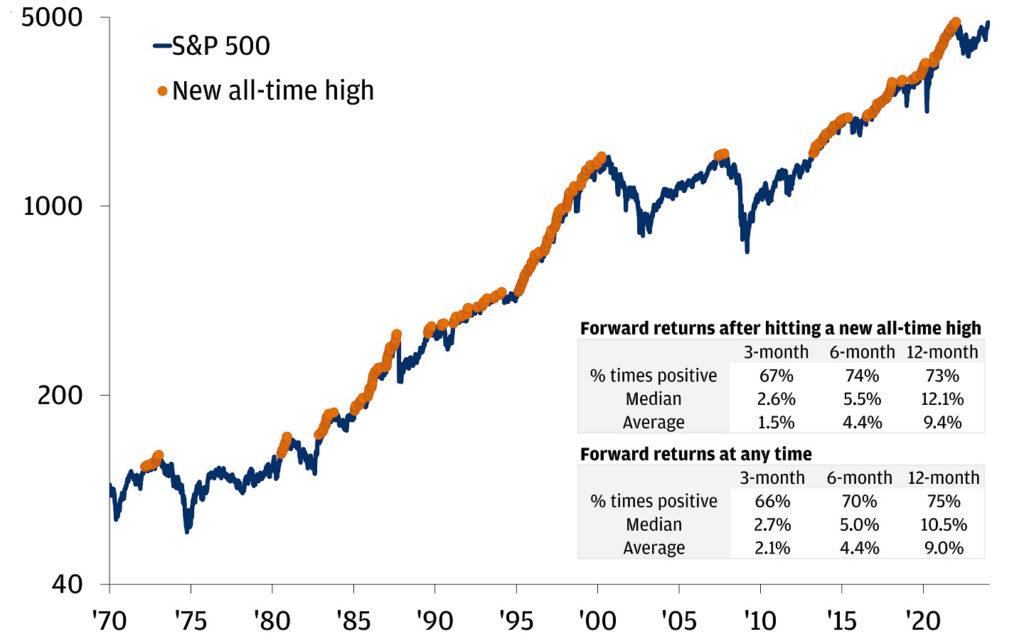
Isn’t it amazing how different the market feels at the start of 2024 compared to last year? At this time last year, everyone was feeling pessimistic about the markets, bracing for a recession and expecting another down year. For now, the economy remains resilient, inflation continues to show signs of cooling and the S&P 500 has bounced back to within 1% of its all-time high, set in January 2022.
The markets continue to find ways to surprise investors and do the unexpected. We never know when a “black swan” event may arise, but that doesn’t prevent TV pundits and economists from making wild forecasts about market crashes or what cliff we may fall off next.
No matter what is in store for us in the year ahead, here are four keys to keeping your long-term plan on track:
1. Manage your election-year anxiety.
Political news will dominate the headlines for 2024, here in the United States and elsewhere. More than half of the world’s population will go to the polls this year, including last week’s election in Taiwan. As we all know, the U.S. election is set to be contentious and anxiety-provoking.
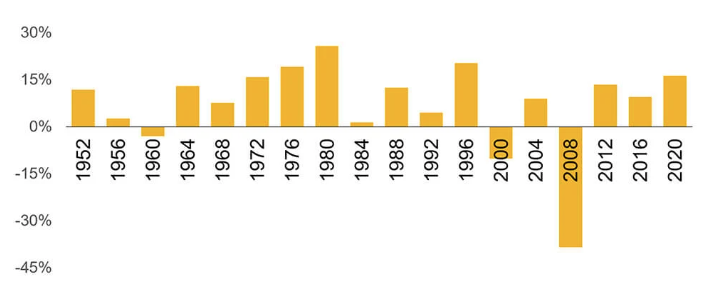
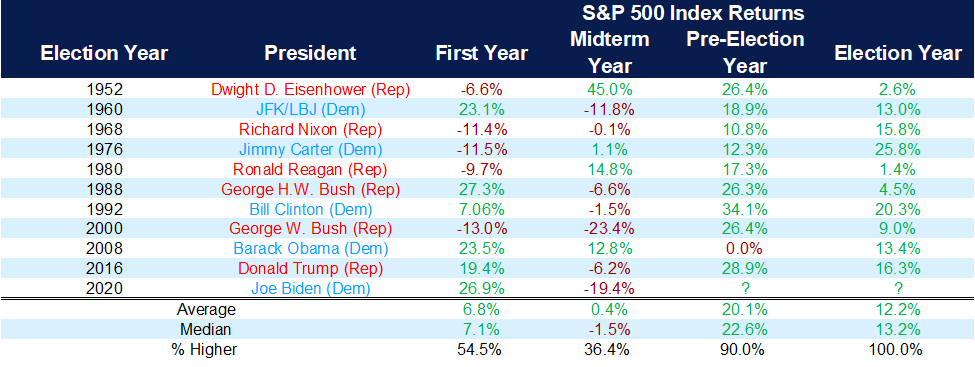
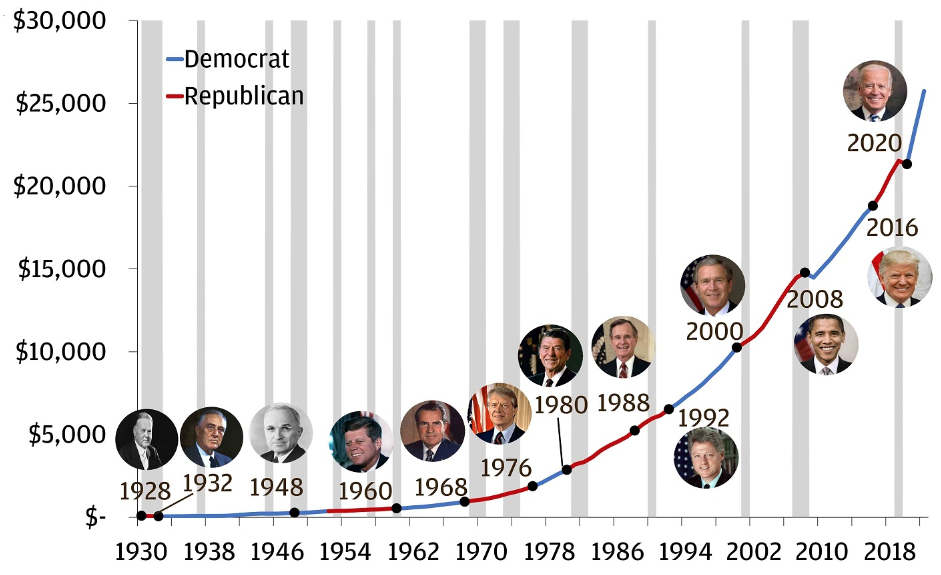
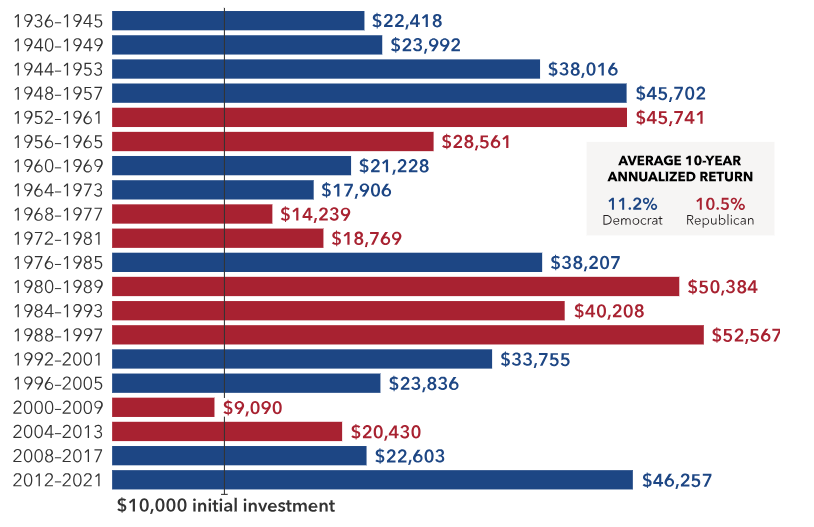
Election uncertainty probably will trigger higher market volatility. Historically, the party that wins the election has had little impact on long-term market returns. As measured by the S&P 500, the 10-year annualized return of stocks from the start of an election year is over 10% for both Republicans and Democrats. If volatility arises this year, it will provide opportunities for investors who stay focused on long-term investments.
Red, Blue and You: Politics Don’t Matter Much for Investors
10-year growth of hypothetical $10K investment made in the S&P 500 Index at start of election year (USD)
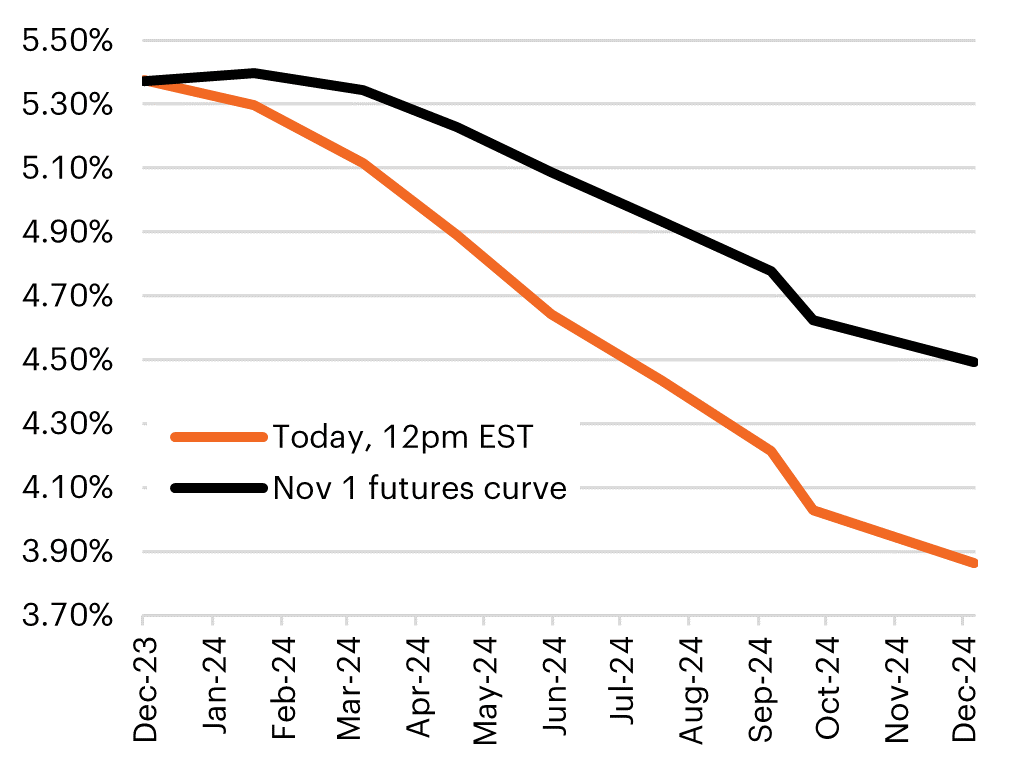
2. Consider your cash carefully.
Cash may not be as attractive as we think this year. Investors shifted trillions of dollars into cash in 2022 and 2023. Money market funds are sitting at almost $6 trillion, a record level of cash. According to NDR data, money market funds added $1.4 trillion in 2023.
Not all that money is from funds that came out of the stock market. Investors shifted money from bank deposits to money market funds to take advantage of the higher yields, as banks are offering less yield than a traditional money market fund. While it is important to have your rainy-day cash bucket, cash as a long-term investment might not be as attractive as you think.
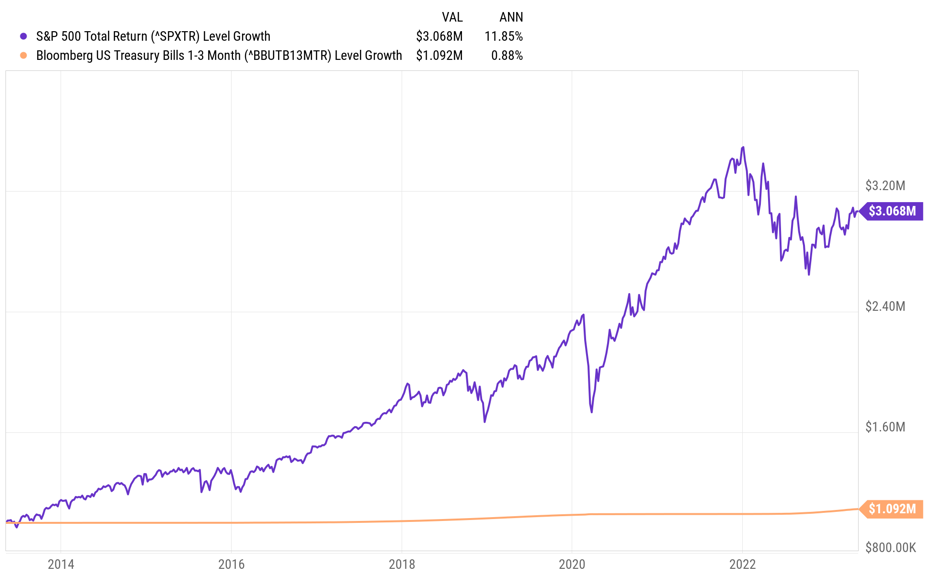
The risk is the opportunity cost of waiting to invest. The chart below compares stocks to cash over 10 years from May 2013 to May 2023; the market returned almost three times more than cash over that same time. That is the opportunity cost.
Cash vs. Stocks: Growth of $1M
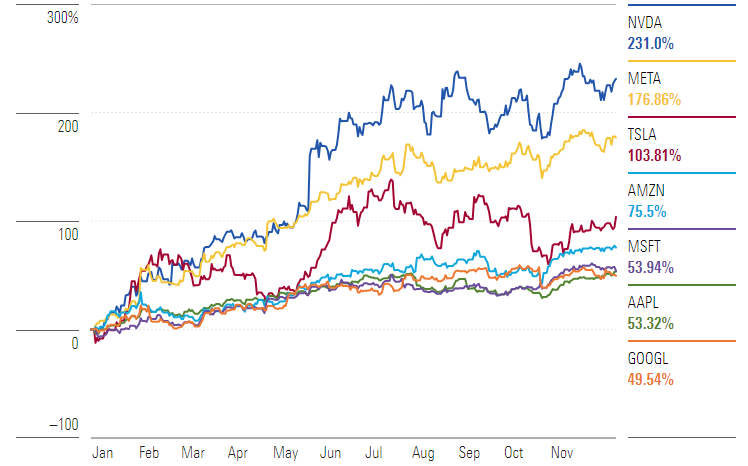
3. Pay attention to innovation and diversification.
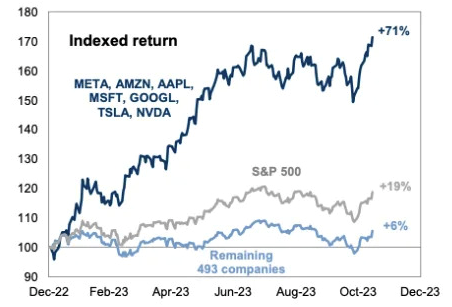
Artificial intelligence captured the heart of investors in 2023. We all know the story of the Magnificent Seven tech stocks and their effect on market returns last year. At the end of 2023, the 10 largest companies in the S&P 500 accounted for almost 31% of the market capitalization. With such a small number of companies accounting for a sizeable portion of market returns, diversification took a back seat last year until late in the fourth quarter.
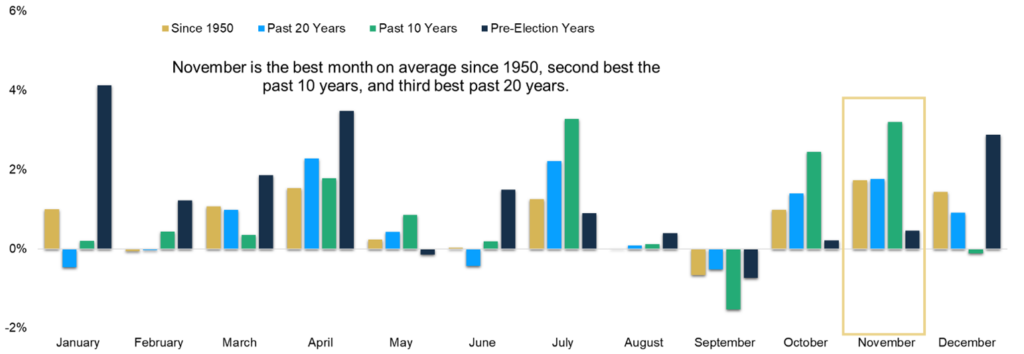
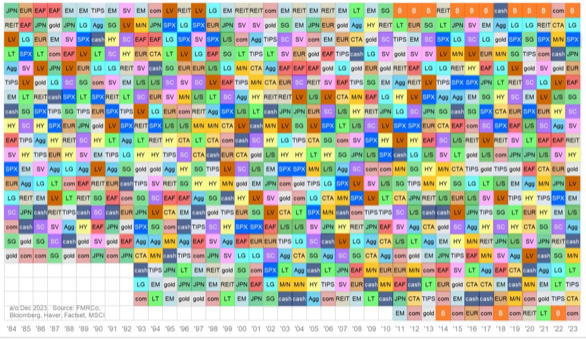
Innovation is not going away as AI is still in the early stages of a long-term play. However, diversification remains essential. As seen in the chart below, asset classes perform differently from year to year — and rarely do the same ones remain at the top. Bonds failed to provide diversification in 2022, and that trend continued for much of last year.
However, with inflation falling faster than expected and the Fed indicating that it is done raising rates, bonds rallied in the fourth quarter and ended the year in the positive. The end of a tightening cycle has historically been a good time to own bonds, providing additional diversification outside of equities.
The Periodic Table of Investment Returns
4. Remember that the markets are resilient.
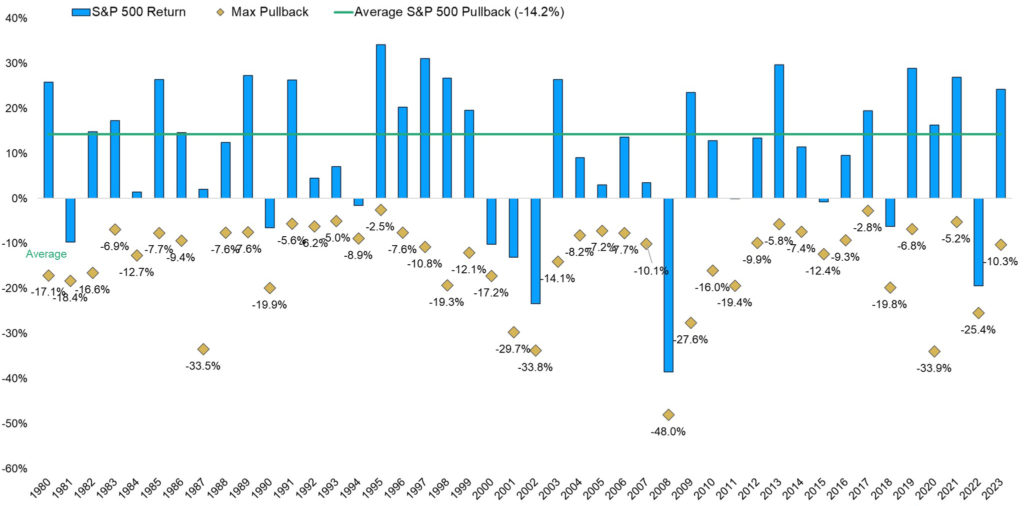
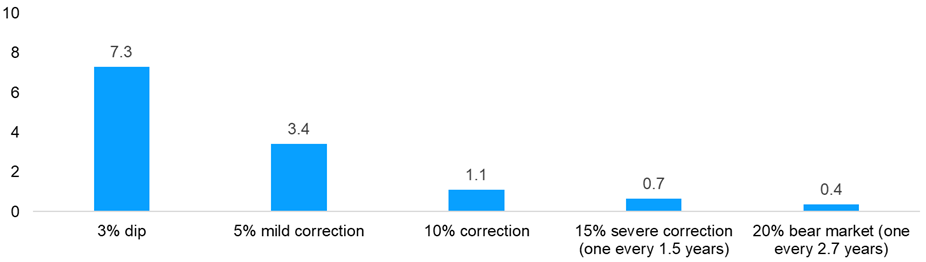
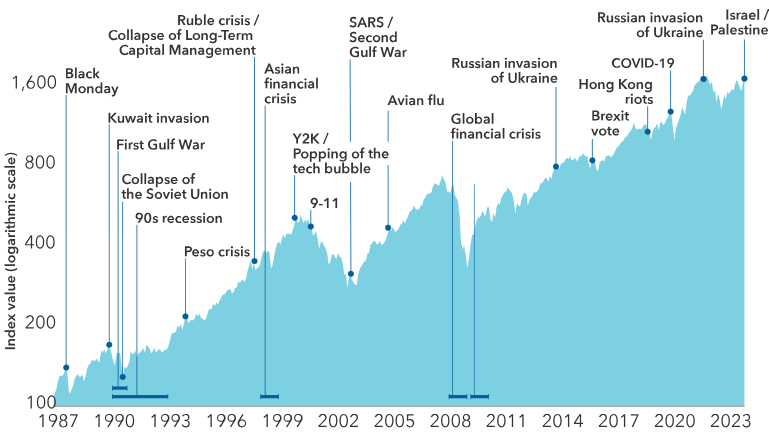
Investors can always find reasons not to invest: war, interest rates, government strife, politics — almost 20 separate events over the last 25 years. Each one of those felt momentous at the time. Look at the chart below; notice the missed returns if you used those events as reasons not to invest.
Many of the worries that weighed heavily on the markets in 2023 have dissipated, but the markets and the economy still face plenty of risks. Undoubtedly, we will experience similar events going forward, but it is critically important to remember that markets are resilient — and historically, they have always bounced back.
Market Disturbances Are Inevitable and Frequent
MSCI All Country World Index
The CD Wealth Formula
We help our clients reach and maintain financial stability by following a specific plan, catered to each client.
Our focus remains on long-term investing with a strategic allocation while maintaining a tactical approach. Our decisions to make changes are calculated and well thought out, looking at where we see the economy is heading. We are not guessing or market timing. We are anticipating and moving to those areas of strength in the economy — and in the stock market.
We will continue to focus on the fact that what really matters right now is time in the market, not out of the market. That means staying the course and continuing to invest, even when the markets dip, to take advantage of potential market upturns. We continue to adhere to the tried-and-true disciplines of diversification, periodic rebalancing and looking forward, while not making investment decisions based on where we have been.
It is important to focus on the long-term goal, not on one specific data point or indicator. Long-term fundamentals are what matter. In markets and moments like these, it is essential to stick to the financial plan. Investing is about following a disciplined process over time.
Sources: Capital Group, Fidelity, Kestra Investment Management, Marketwatch, YCharts

This material contains an assessment of the market and economic environment at a specific point in time and is not intended to be a forecast of future events, or a guarantee of future results. Forward-looking statements are subject to certain risks and uncertainties. Actual results, performance, or achievements may differ materially from those expressed or implied. Information is based on data gathered from what we believe are reliable sources.
Using diversification as part of your investment strategy neither assures nor guarantees better performance and cannot protect against loss of principal due to changing market conditions.
Past performance is not a guarantee of future results.
The opinions expressed in this commentary are those of the author and may not necessarily reflect those held by Kestra Investment Services, LLC or Kestra Advisory Services, LLC. This is for general information only and is not intended to provide specific investment advice or recommendations for any individual. It is suggested that you consult your financial professional, attorney, or tax advisor with regard to your individual situation.
Securities offered through Kestra Investment Services, LLC (Kestra IS), member FINRA/SIPC. Investment Advisory Services offered through Kestra Advisory Services, LLC (Kestra AS) an affiliate of Kestra IS. CD Wealth Management and Bluespring Wealth Partners LLC* are affiliates of Kestra IS and Kestra AS. Investor Disclosures: https://bit.ly/KF-Disclosures
*Bluespring Wealth Partners, LLC acquires and supports high quality investment adviser and wealth management companies throughout the United States.
Fidelity Investments and Fidelity Institutional® (together “Fidelity”) is an independent company, unaffiliated with Kestra Financial or CD Wealth Management. Fidelity is a service provider to both. There is no form of legal partnership, agency affiliation, or similar relationship between your financial advisor and Fidelity, nor is such a relationship created or implied by the information herein. Fidelity has not been involved with the preparation of the content supplied by CD Wealth Management and does not guarantee, or assume any responsibility for, its content. Fidelity Investments is a registered service mark of FMR LLC. Fidelity Institutional provides clearing, custody, or other brokerage services through National Financial Services LLC or Fidelity Brokerage Services LLC, Members NYSE, SIPC.