Positive momentum, economic expansion and rising business confidence

The markets continue to climb, lifted by positive economic data, such as manufacturing, homebuilding and increased employment. As vaccines become more widespread and the public begins to venture out, businesses will continue to reopen, and their capacity will expand. All signs point toward a strong GDP in 2021 as fiscal and monetary stimuli pump an unprecedented amount of liquidity into the economy.

The improving business confidence may translate into strong capital goods shipments as well, and hiring is picking up, as seen by the March job numbers. Restaurants will continue to add capacity, as will the airline and hospitality industries. Positive momentum for the global economy widens the range of outcomes for how strong our GDP may be in 2021.

Earnings, interest rates and inflation are three ingredients that will help determine the trajectory of stock prices over the next several years. Earnings expectations continue to remain a bright spot for the stock market. The expectations for 2021 earnings on the S&P 500 are 26% higher than in 2020; these estimates continue to rise, and projections may move even higher. The Fed has made it clear that interest rates will remain low through 2022, even though the 10-year and 30-year Treasury rates may continue to move higher. Stocks have been relatively unfazed with the rise in the 10-year Treasury bond.

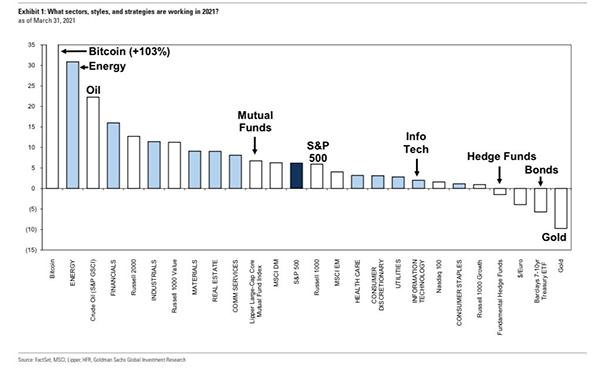
The first quarter in the stock market did see sector rotation taking place, as seen in the chart below. Large-cap growth stocks finished the quarter basically flat, while value stocks outperformed. The sectors that have been leading the last few years, such as information technology and consumer discretionary, lagged in the first quarter, while energy and financials were strong performers. One could argue that these sectors were due for a break after the tremendous run the last two years, but rising rates also were a factor. 
It is natural to be apprehensive about the market, given the current levels. Skepticism and caution can lead to focusing on near-term issues, instead of concentrating on the endgame. Economic expansions since World War II have lasted 26 quarters on average, with the shortest expansion being 11 quarters and the longest 48 quarters. The current cycle is only five quarters old. During expansions, markets may take a breather and have a correction, but keeping an eye on the long term remains the best approach.

So, what can we learn from all this? Markets go up and down over time. The key is to stay invested and stick with the financial plan. Market downturns present opportunities to purchase stocks that were previously viewed as overvalued. In a down market, you are “buying low,” one of the fundamental tenets of investing. 

Given the difficulty of timing the market, the most realistic strategy for a majority of investors is to invest and stay invested over time. Procrastination, or not investing, is worse than bad timing. We continue to view more risk being out of the market than in the market. Riding out future market volatility, in addition to having a diversified portfolio, means staying the course. From an investment perspective, we use trends to help with the strategic and tactical asset allocation and where we see the portfolio heading over the next 5-7 years with short-term adjustments along the way. 

It all starts with a solid financial plan for the long run that understands the level of risk that is acceptable for each client. With regards to investments, we believe in diversification and having different asset classes that allow you to stay invested. The best option is to stick with a broadly diversified portfolio that can help you to achieve your own specific financial goals — regardless of market volatility. Long-term fundamentals are what matter.

Sources: Factset, Smith Asset Management

This material contains an assessment of the market and economic environment at a specific point in time and is not intended to be a forecast of future events, or a guarantee of future results. Forward-looking statements are subject to certain risks and uncertainties. Actual results, performance, or achievements may differ materially from those expressed or implied. Information is based on data gathered from what we believe are reliable sources.

Using diversification as part of your investment strategy neither assures nor guarantees better performance and cannot protect against loss of principal due to changing market conditions.

Past performance is not a guarantee of future results.

The opinions expressed in this commentary are those of the author and may not necessarily reflect those held by Kestra Investment Services, LLC or Kestra Advisory Services, LLC. This is for general information only and is not intended to provide specific investment advice or recommendations for any individual. It is suggested that you consult your financial professional, attorney, or tax advisor with regard to your individual situation.

Securities offered through Kestra Investment Services, LLC (Kestra IS), member FINRA/SIPC. Investment Advisory Services offered through Kestra Advisory Services, LLC (Kestra AS) an affiliate of Kestra IS. Kestra IS and Kestra AS are not affiliated with CD Wealth Management. Investor Disclosures: https://bit.ly/KF-Disclosures

4 takeaways for investors as the bull market turns 1

It has been a year since a historic health crisis swept the world, and we remain truly thankful for the healthcare professionals who have continually risked their lives to care for the rest of us. We also mourn the more than 500,000 lives lost in the U.S. — and the 2.75 million deaths worldwide.

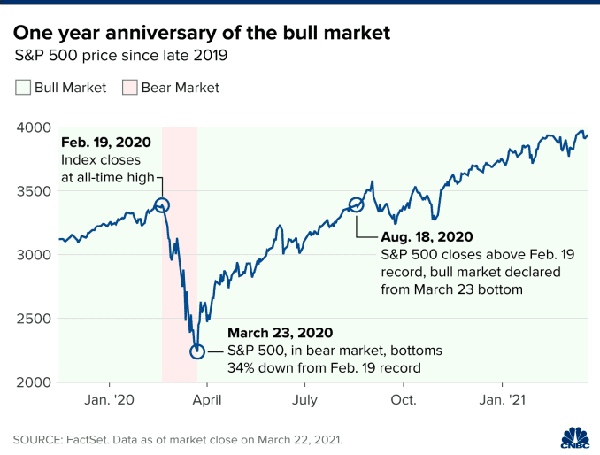
While we are glad to be on the path toward reopening venues and working toward a sense of normalcy, we also are aware that this week marks the anniversary of the S&P 500 reaching its bottom. On March 23, 2020, it had experienced a 30% decline in only 22 days, the biggest decline on record in such a short period of time. 

Among our investment takeaways:

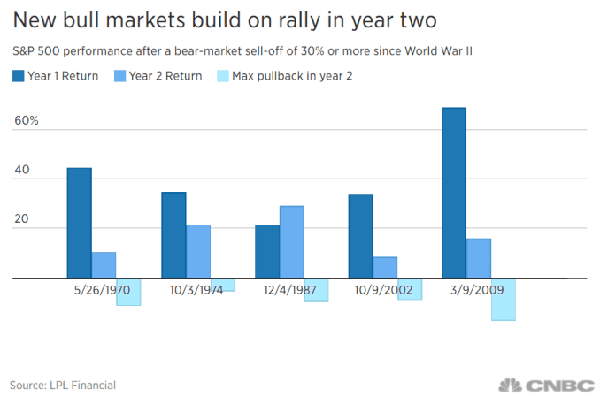
1. Stay invested and diversified. The market sell-off in February and March saw investments in both stocks and bonds tumble by double digits. However, as we discuss in every weekly letter, staying the course proved to be the prudent course of action. Since its low point in March 2020, the S&P 500 has risen more than 65%. Investors who sold their holdings in the midst of the decline and stayed on the sidelines missed the recovery and the upside gains, potentially altering their long-term financial plans in a negative way. Historically, strong bull markets usually follow big bear market declines, with gains carrying into a second year.

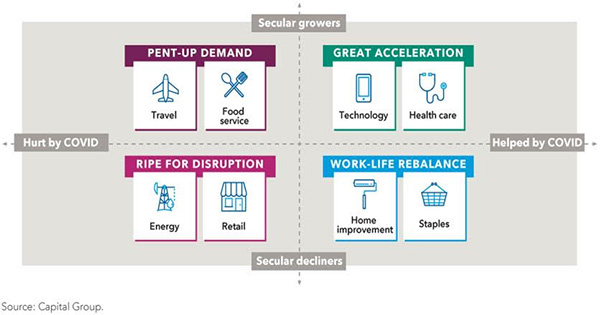
2. Look for opportunities along the way.  Not only is it critical to stay the course, but it also is important to be both strategic and tactical with investment allocations. Last year, the world experienced a technological advancement due to the pandemic, and a group of stay-at-home stocks in the technology and healthcare sector performed very well. Technological and macro-economic trends accelerated due to COVID-19, presenting long-term investment opportunities. When the vaccines were announced in November and the world anticipated the reopening of the economy, small-cap stocks became more attractive, along with service and hospitality stocks. This doesn’t mean that technology and healthcare stocks are less favorable, but we continue to invest where we believe the market is moving, not where it currently sits.

3. There is a movement toward sustainable investing, such as worker health and safety, climate change and fossil fuel reductions — and not just with younger investors. More and more companies will focus on ESG (environmental, social and governance) as part of their corporate operations.

4. Tax Loss Harvesting. When markets experience large declines, selling current holdings and capturing realized losses will help offset future taxable gains. This does not mean investors should sell and get out of the market. Instead, swap one holding for a similar holding to maintain market exposure, and create a taxable loss. Then, in the future, when you sell the holding for a hopeful gain, you have a realized loss that may reduce the amount of tax that you owe on the gain. This is prudent investment strategy.  

So, what can we learn from all this? Markets go up and down over time. The key is to stay invested and stick with the financial plan. Market downturns present opportunities to purchase stocks that were previously viewed as overvalued. In a down market, you are “buying low,” one of the fundamental tenets of investing.

We are not trying to time the market. We continue to view more risk being out of the market than in the market. Riding out future market volatility in addition to having a diversified portfolio means staying the course. From an investment perspective, we use trends to help with the strategic and tactical asset allocation and where we see the portfolio heading over the next 5-7 years with short-term adjustments along the way. 

It all starts with a solid financial plan for the long run that understands the level of risk that is acceptable for each client. With regards to investments, we believe in diversification and having different asset classes that allow you to stay invested. The best option is to stick with a broadly diversified portfolio that can help you to achieve your own specific financial goals – regardless of market volatility.  Long-term fundamentals are what matter.

Sources: CNBC, LPL

This material contains an assessment of the market and economic environment at a specific point in time and is not intended to be a forecast of future events, or a guarantee of future results. Forward-looking statements are subject to certain risks and uncertainties. Actual results, performance, or achievements may differ materially from those expressed or implied. Information is based on data gathered from what we believe are reliable sources.

Using diversification as part of your investment strategy neither assures nor guarantees better performance and cannot protect against loss of principal due to changing market conditions.

Past performance is not a guarantee of future results.

The opinions expressed in this commentary are those of the author and may not necessarily reflect those held by Kestra Investment Services, LLC or Kestra Advisory Services, LLC. This is for general information only and is not intended to provide specific investment advice or recommendations for any individual. It is suggested that you consult your financial professional, attorney, or tax advisor with regard to your individual situation.

Securities offered through Kestra Investment Services, LLC (Kestra IS), member FINRA/SIPC. Investment Advisory Services offered through Kestra Advisory Services, LLC (Kestra AS) an affiliate of Kestra IS. Kestra IS and Kestra AS are not affiliated with CD Wealth Management. Investor Disclosures: https://bit.ly/KF-Disclosures

What portfolio changes are we making as the first quarter ends?

As we near the end of the first quarter of 2021, we’d like to review where we’ve been and let you know where we are headed with the portfolio. The year started the same way 2020 ended: with the stock market continuing its upward momentum, led by large-cap stocks — specifically, technology companies. Then Bitcoin caught the public’s attention, as did GameStop maniaThe 10-year Treasury has increased from 0.9% to 1.6%, and the NASDAQ experienced a correction, albeit a very brief one. 

We are in the process of reallocating and rebalancing the portfolios to account for the economic recovery and the economic lifecycle of the U.S. and the world. We are making the following changes:

1. After increasing our technology position in 2020 to align the portfolio with the technological boom that resulted from the pandemic, we are reducing our exposure in technology to a market-weight level. Looking at the long term, we continue to believe strongly in the technology sector and will continue to have a strong weighting. As more people have access to the vaccine, however, the economy continues to reopen and broaden. Travel is increasing, people are eating out more, and stocks that were out of favor last year are becoming more relevant this year.  

2. International equities remain less expensive on a price-to-earnings multiple basis, compared to the U.S. stock market, and we are adding to our current position. We believe that small- and mid-cap stocks will benefit from the economic reopening, and we are increasing our current allocation. At the same time, we are increasing our allocation to higher dividend-yielding companies that have a broad exposure to the overall economy in sectors like financials, energy and industrials.

3. From a fixed-income perspective, we are reducing our current weighting in high-quality corporate bonds and adding a strategic income fund that provides diversification to different asset classes within fixed income. As interest rates rise, certain fixed-income segments invest in bonds that rise with higher rates and provide increased flexibility within the portfolio.

Our focus remains on long-term investing with a strategic allocation while maintaining a tactical approach. Our decisions to make changes are calculated and well thought-out, looking at where the economy is heading. We are not guessing or timing the market. We are anticipating and moving to those areas of strength in the economy and in the stock market. 

We strategically have new cash on the sidelines and buy in for those clients on down days or dips in the market – like one does in a 401K every other week. We speak with our clients regularly about staying the course and not listening to the economic noise.

In the short term, the outlook for the global economy continues to improve – specifically, with the recent passage of a $1.9 trillion stimulus package and millions receiving their vaccinations. The Federal Reserve has stated on many occasions that it plans to allow mild inflation to increase and reach above 2% for the foreseeable future — and it is unlikely to raise short-term interest rates in the near future. 

So, what can we learn from all this? From an investment perspective, we use these trends to help with the strategic and tactical asset allocation and where we see the portfolio heading over the next 5-7 years, with short-term adjustments along the way. We are not trying to time the market. We continue to view more risk being out of the market than in the market. Riding out future market volatility in addition to having a diversified portfolio means staying the course. 

It all starts with a solid financial plan for the long run that understands the level of risk that is acceptable for each client. With regards to investments, we believe in diversification and having different asset classes that allow you to stay invested. The best option is to stick with a broadly diversified portfolio that can help you to achieve your own specific financial goals – regardless of market volatility.  Long-term fundamentals are what matter.

This material contains an assessment of the market and economic environment at a specific point in time and is not intended to be a forecast of future events, or a guarantee of future results. Forward-looking statements are subject to certain risks and uncertainties. Actual results, performance, or achievements may differ materially from those expressed or implied. Information is based on data gathered from what we believe are reliable sources.

Using diversification as part of your investment strategy neither assures nor guarantees better performance and cannot protect against loss of principal due to changing market conditions.

Past performance is not a guarantee of future results.

The opinions expressed in this commentary are those of the author and may not necessarily reflect those held by Kestra Investment Services, LLC or Kestra Advisory Services, LLC. This is for general information only and is not intended to provide specific investment advice or recommendations for any individual. It is suggested that you consult your financial professional, attorney, or tax advisor with regard to your individual situation.

Securities offered through Kestra Investment Services, LLC (Kestra IS), member FINRA/SIPC. Investment Advisory Services offered through Kestra Advisory Services, LLC (Kestra AS) an affiliate of Kestra IS. Kestra IS and Kestra AS are not affiliated with CD Wealth Management. Investor Disclosures: https://bit.ly/KF-Disclosures

A closer look at the NASDAQ market correction

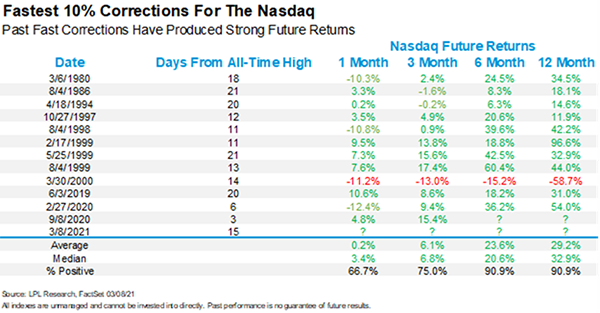
The stock market is worried that longer-term interest rates will continue their upward trend and that the Federal Reserve may not be able to control it. Technology stocks are in a correction. The NASDAQ is more than 10% down from its recent historic high three weeks ago. Many large-cap technology names, like the fabled FAANG stocks (Facebook, Apple, Amazon, Netflix and Google) are down even more. These same technology stocks led us out of the depths of the pandemic, so some pullback is to be expected. 

Why do growth stocks tend to sell off with rising interest rates? The method Wall Street uses to value stocks is to discount future cash flows to what they may be worth in today’s dollars. Stocks are valued based on how much cash they can generate in the future. We then must figure out the present value of the expected future stream of cash flows. No one knows how much cash a company will generate next year or years from now; many factors are involved, such as the economy, company management, competition and the nature of the business. The farther one looks into the future, the harder it is to estimate future cash flows.

After you estimate future cash flows, you need to make a guess on what interest rate should be used to discount those cash flows to today’s dollars. A dollar today won’t be worth a dollar five years from now; it will be worth less. The higher the interest rate you use to discount cash flows, the less a dollar five years from now will be worth today. From a market perspective, as rates rise and a higher interest rate is used to discount future cash flows, the less a company may be worth. This is why the same growth stocks that have performed so well for the last year are now in correction mode: the fear of higher rates and what they may do to future valuations.

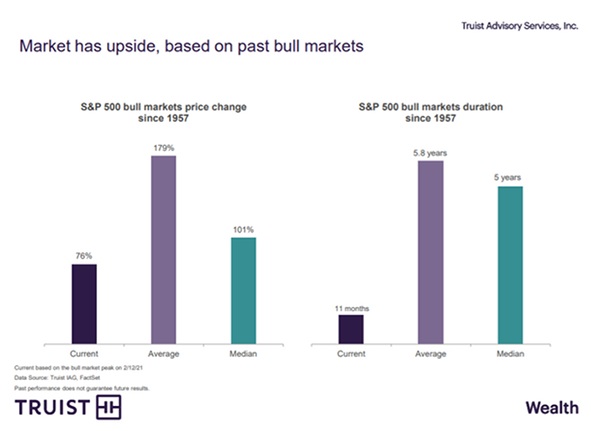
The current bull market for the S&P 500, which started in April 2020, is only 11 months old. As the chart below shows, the average S&P 500 bull market lasts almost six years, with an average gain of 179%. Within every bull market, multiple corrections may occur. According to data from Yardeni Research, there have been 38 declines of at least 10% in the S&P 500 since 1950 — that’s a double-digit decline almost every two years. In the past 11 years, there have been seven double-digit declines and at least eight others ranging from 5.8% to 9.9%. Corrections are a healthy and normal occurrence and not a reason to change direction.

There remains a strong case for continuing to buy the dips and stay the course with equity allocations: 

* Washington is moving forward with passing a $1.9 trillion fiscal relief package in March, with stimulus checks being mailed out at the end of the month.

* The Federal Reserve has been strong in its policy stance and will remain patient with regard to short-term interest rates.

* The U.S. economy is reopening, and momentum is very strong.

* Millennials are investing in equities, and the surge in retail brokerage account openings is further evidence of this trend.

* Short-term bond rates will remain close to zero, making stocks more attractive than cash in the bank.

* The chart below looks at the fastest corrections in the NASDAQ and what has historically followed for index returns.

So, what can we learn from all this? Market corrections are a normal occurrence. The key, as we mention on a regular basis, is to stay the course. Selling into a correction may have long-term negative financial consequences for your financial plan.

We use the above insights to help with the strategic and tactical asset allocation based on where we see the portfolio heading over the next five to seven years, with short-term adjustments along the way. We are not trying to time the market, but we will try to take advantage when we see where the stock and bond market heading. Having a well-balanced, diversified, liquid portfolio and a financial plan are keys to successful investing. The best option is to stick with a broadly diversified portfolio that can help you to achieve your own specific financial goals – regardless of market volatility. Long-term fundamentals are what matter.

Sources: Marketwatch, Yardeni, Truist, LPL

_____

This material contains an assessment of the market and economic environment at a specific point in time and is not intended to be a forecast of future events, or a guarantee of future results.  Forward-looking statements are subject to certain risks and uncertainties.  Actual results, performance, or achievements may differ materially from those expressed or implied.  Information is based on data gathered from what we believe are reliable sources.

Using diversification as part of your investment strategy neither assures nor guarantees better performance and cannot protect against loss of principal due to changing market conditions.

Past performance is not a guarantee of future results.

The MSCI Europe Index is a free float-adjusted market capitalization weighted index that is designed to measure the equity market performance of the developed markets in Europe. The MSCI EAFE Index (Europe, Australasia, Far East) is a free float-adjusted market capitalization index that is designed to measure the equity market performance of developed markets, excluding the US & Canada. The MSCI World Index is a free float-adjusted market capitalization weighted index that is designed to measure the equity market performance of developed markets. The MSCI Emerging Markets Index is a free float-adjusted market capitalization index that is designed to measure equity market performance of emerging markets. The MSCI AC (All Country) Asia ex Japan Index is a free float-adjusted market capitalization weighted index that is designed to measure the equity market performance of Asia, excluding Japan. The Dow Jones Industrial Average is a popular indicator of the stock market based on the average closing prices of 30 active U.S. stocks representative of the overall economy.

S&P 500 Index is an unmanaged group of securities considered to be representative of the stock market in general. NASDAQ Composite Index measures all NASDAQ domestic and international based common type stocks listed on The NASDAQ Stock Market. The Russell 2000 Index measures the performance of the small-cap segment of the U.S. equity universe. It is not possible to invest directly in an index.
The opinions expressed in this commentary are those of the author and may not necessarily reflect those held by Kestra Investment Services, LLC or Kestra Advisory Services, LLC.  This is for general information only and is not intended to provide specific investment advice or recommendations for any individual.  It is suggested that you consult your financial professional, attorney, or tax advisor with regard to your individual situation.

Securities offered through Kestra Investment Services, LLC (Kestra IS), member FINRA/SIPC. Investment Advisory Services offered through Kestra Advisory Services, LLC (Kestra AS) an affiliate of Kestra IS. Kestra IS and Kestra AS are not affiliated with CD Wealth Management.

Unemployment down, markets up: What happens next?

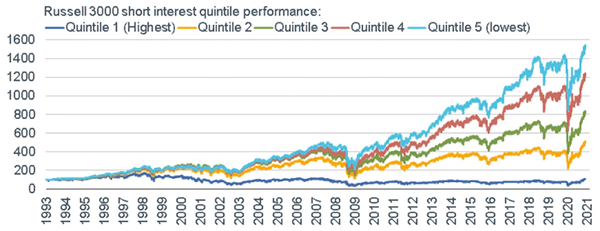
The GameStop mania appears to be fading as quickly as it appeared, with shares down roughly 70% last week. As the chart below shows, the stocks that are the most heavily shorted (or bet against) have the worst performance over time — and stocks that are shorted the least have much better results. The reason this is true? Company fundamentals. The recent spike in the most heavily shorted stocks is an aberration, not a common occurrence.

Quintile 1 represents the most heavily shorted stocks; Quintile 5 represents the least.

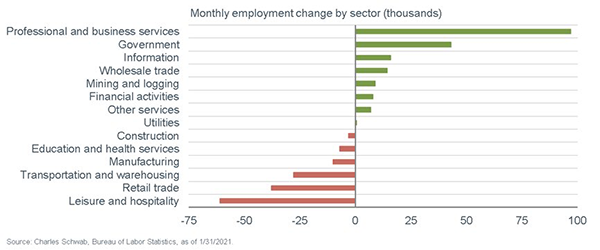
The markets now are able to focus again on the positive macro-economic backdrop: liquidity in the economy, vaccines in arms and low interest rates. The S&P 500 and NASDAQ both hit record highs last week, as investors are focusing on what the future holds rather than where the economy is today. Speaking of the economy, the U.S. unemployment rate fell from 6.7% in December to a lower-than-expected 6.3% in January, the lowest level since the pandemic started. Some people found new jobs, while others left the workforce entirely. Gains were seen in professional and business services, as well as in government employment, while retail, leisure and hospitality jobs continue to suffer.

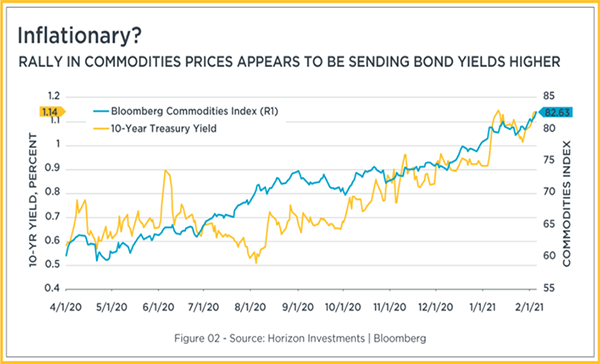
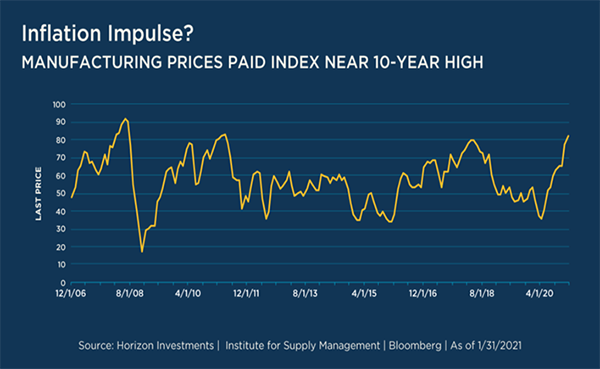
Treasury bond yields also rose last week, reaching levels not seen since March. If inflation remains in check, the Fed can keep monetary policy easy, which helps bonds and provides diversification from stocks. The services sector, the largest piece of the Consumer Price Index, continues to fall, contributing to the lower level of inflation — whereas commodity prices (especially oil) are seeing a resurgence in price as supplies are starting to decrease. This also affects the Manufacturing Prices Paid Index, which also is trading at nearly a 10-year high, as higher commodity prices flow through to the cost of producing goods.

We do expect to see some inflation volatility in the near to medium term as economic activity resumes and price comparisons with weaker numbers from last year push inflation higher. We do not expect these effects to result in sustained inflationary pressure, and we anticipate that the trend will reverse in the second half of the year, after the economy reopens further.

So, what can we learn from all this? The vaccination rollout, U.S. monetary policy with regard to inflation and an additional stimulus all play an important role in direction of the market in 2021, with potential for further upside growth. We will continue to stay the course, and while we know there will be bumps in the road in 2021, the public markets will continue to look forward, anticipating what is ahead. 

From an investment perspective, we use the above insights to help with the strategic and tactical asset allocation based on where we see the portfolio heading over the next five to seven years, with short-term adjustments along the way. We are not trying to time the market, but we will try to take advantage when we see where the market is heading. Having a well-balanced, diversified, liquid portfolio and a financial plan are keys to successful investing. The best option is to stick with a broadly diversified portfolio that can help you achieve your own specific financial goals – regardless of market volatility. Long-term fundamentals are what matter.

Sources:  Horizon Investments, Bureau of Labor Statistics, Charles Schwab

_____

This material contains an assessment of the market and economic environment at a specific point in time and is not intended to be a forecast of future events, or a guarantee of future results.  Forward-looking statements are subject to certain risks and uncertainties.  Actual results, performance, or achievements may differ materially from those expressed or implied.  Information is based on data gathered from what we believe are reliable sources.

Using diversification as part of your investment strategy neither assures nor guarantees better performance and cannot protect against loss of principal due to changing market conditions.

Past performance is not a guarantee of future results.

The MSCI Europe Index is a free float-adjusted market capitalization weighted index that is designed to measure the equity market performance of the developed markets in Europe. The MSCI EAFE Index (Europe, Australasia, Far East) is a free float-adjusted market capitalization index that is designed to measure the equity market performance of developed markets, excluding the US & Canada. The MSCI World Index is a free float-adjusted market capitalization weighted index that is designed to measure the equity market performance of developed markets. The MSCI Emerging Markets Index is a free float-adjusted market capitalization index that is designed to measure equity market performance of emerging markets. The MSCI AC (All Country) Asia ex Japan Index is a free float-adjusted market capitalization weighted index that is designed to measure the equity market performance of Asia, excluding Japan. The Dow Jones Industrial Average is a popular indicator of the stock market based on the average closing prices of 30 active U.S. stocks representative of the overall economy.

S&P 500 Index is an unmanaged group of securities considered to be representative of the stock market in general. NASDAQ Composite Index measures all NASDAQ domestic and international based common type stocks listed on The NASDAQ Stock Market. The Russell 2000 Index measures the performance of the small-cap segment of the U.S. equity universe. It is not possible to invest directly in an index.

The opinions expressed in this commentary are those of the author and may not necessarily reflect those held by Kestra Investment Services, LLC or Kestra Advisory Services, LLC.  This is for general information only and is not intended to provide specific investment advice or recommendations for any individual.  It is suggested that you consult your financial professional, attorney, or tax advisor with regard to your individual situation.

Securities offered through Kestra Investment Services, LLC (Kestra IS), member FINRA/SIPC. Investment Advisory Services offered through Kestra Advisory Services, LLC (Kestra AS) an affiliate of Kestra IS. Kestra IS and Kestra AS are not affiliated with CD Wealth Management.

With a new president, what lies ahead?

A new administration took office this week with a renewed focus on vaccinating millions of Americans and on creating additional stimulus to help those most in need. Last week, President Biden announced a proposed $1.9 trillion economic stimulus package, which would follow the recent $900 billion package passed in December. More Americans are receiving the coronavirus vaccination every day. The successful deployment of vaccines remains the key driver of U.S. economic growth for 2021. If Johnson & Johnson is able to win FDA approval for its vaccine by March, we believe the goal of vaccinating 100 million people by the early fall is attainable. These are positives for the stock market long-term.

The pandemic has forced companies big and small to prioritize and expand their digital footprints. The economy will look very different after the pandemic than it did at the start of 2020. Digital business models are expanding beyond the U.S., as companies in both emerging and developed markets have rapidly expanded their platforms. Small and mid-sized companies, as well as international and emerging markets, can benefit greatly from the technological advancements and the reopening of the economy.

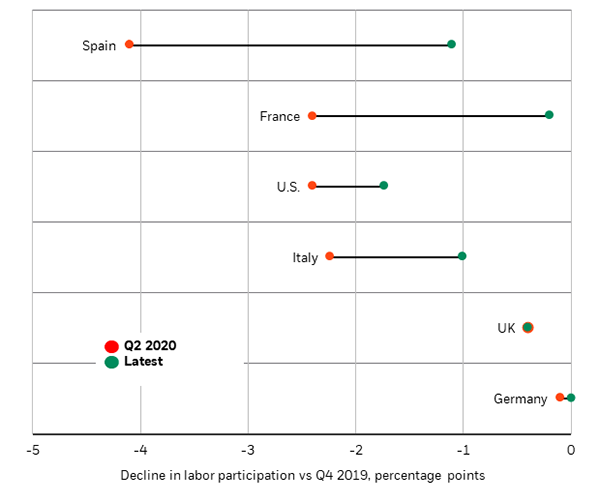
The pandemic also has accelerated shifts in employment, particularly with respect to services sectors that employ low-skilled workers. The share of permanent job losses continues to grow over time, and labor participation rates have yet to recover, as seen in the chart below. 

The shock has caused more strain for smaller companies that do not have access to the same capital markets as large companies to raise additional monies to operate their businesses. The Federal Reserve bank and further economic stimulus proposed by the new administration are set to provide an additional bridge of funds for these companies, with the hope of bringing back activity to pre-pandemic levels.

In 2021, much depends on the increase in debt through additional stimulus. Rising debt ratios may put additional pressure on the Federal Reserve Bank to keep debt service payments lower through continued lower rates. The Consumer Price Index, the measure of inflation, increased in December, due to higher gas prices. However, this increase was in line with expectations and was not as high as many were expecting. Investors’ demands for bonds remain high as a source of diversification, and demand for municipal bonds has increased as investors in the highest tax brackets anticipate higher tax rates, making those bonds more attractive.

So, what can we learn from all this? We will continue to stay the course. While we know there will be bumps in the road in 2021, we also know public markets will continue to look forward, anticipating what’s ahead. From an investment perspective, we use the above insights to help with the strategic and tactical asset allocation based on where we see the portfolio heading over the next five to seven years, with short-term adjustments along the way. We are not trying to time the market, but we will try to take advantage when we see where the market is heading. Having a well-balanced, diversified, liquid portfolio and a financial plan are keys to successful investing. The best option is to stick with a broadly diversified portfolio that can help you achieve your own specific financial goals – regardless of market volatility. Long-term fundamentals are what matter.

Sources: Capital Group, Blackrock

_____

This material contains an assessment of the market and economic environment at a specific point in time and is not intended to be a forecast of future events, or a guarantee of future results.  Forward-looking statements are subject to certain risks and uncertainties.  Actual results, performance, or achievements may differ materially from those expressed or implied.  Information is based on data gathered from what we believe are reliable sources.

Using diversification as part of your investment strategy neither assures nor guarantees better performance and cannot protect against loss of principal due to changing market conditions.

Past performance is not a guarantee of future results.

The MSCI Europe Index is a free float-adjusted market capitalization weighted index that is designed to measure the equity market performance of the developed markets in Europe. The MSCI EAFE Index (Europe, Australasia, Far East) is a free float-adjusted market capitalization index that is designed to measure the equity market performance of developed markets, excluding the US & Canada. The MSCI World Index is a free float-adjusted market capitalization weighted index that is designed to measure the equity market performance of developed markets. The MSCI Emerging Markets Index is a free float-adjusted market capitalization index that is designed to measure equity market performance of emerging markets. The MSCI AC (All Country) Asia ex Japan Index is a free float-adjusted market capitalization weighted index that is designed to measure the equity market performance of Asia, excluding Japan. The Dow Jones Industrial Average is a popular indicator of the stock market based on the average closing prices of 30 active U.S. stocks representative of the overall economy. S&P 500 Index is an unmanaged group of securities considered to be representative of the stock market in general. NASDAQ Composite Index measures all NASDAQ domestic and international based common type stocks listed on The NASDAQ Stock Market. The Russell 2000 Index measures the performance of the small-cap segment of the U.S. equity universe. It is not possible to invest directly in an index.

The opinions expressed in this commentary are those of the author and may not necessarily reflect those held by Kestra Investment Services, LLC or Kestra Advisory Services, LLC.  This is for general information only and is not intended to provide specific investment advice or recommendations for any individual.  It is suggested that you consult your financial professional, attorney, or tax advisor with regard to your individual situation.

Securities offered through Kestra Investment Services, LLC (Kestra IS), member FINRA/SIPC. Investment Advisory Services offered through Kestra Advisory Services, LLC (Kestra AS) an affiliate of Kestra IS. Kestra IS and Kestra AS are not affiliated with CD Wealth Management.

Should politics sway your investment strategy?

U.S. stock markets rallied to record highs last week, and bond yields rose after the Democrats won two Senate runoff elections in Georgia, providing a narrow majority in Congress. Even in the face of what we witnessed in Washington last week, the equity markets pushed higher. 

As we have written in previous articles, the stock market looks forward, not backward. The market’s climb is based in part on the expectation of additional fiscal stimulus being passed in the first quarter of 2021 to help those most hurt by the pandemic, spending on green initiatives and limited tax increases. 

The vaccine rollout has been slower than hoped, and a new, more infectious coronavirus strain is spreading. The pace of the rollout will be a major factor in how quickly the economy can return to pre-pandemic levels. Once the vaccine becomes more widespread, we believe we will see a restart to the economy — and the pent-up demand for goods and services and for travel will bring a return to normalcy. 

The prospects of more fiscal spending under a Democrat-led government could further fuel stocks. Many fear that this could push inflation higher over time. We do expect additional spending to drive deficits higher; as we wrote recently, with interest rates close to zero, additional debt can be more easily digested by the economy than when interest rates are higher. The Federal Reserve’s resolve to keep rates low will help fight inflation and make additional debt payments more modest. Corporate and personal tax increases are possible, but large-scale changes appear unlikely in our view. 

Regardless of who is president or which party controls Congress, the best course of action is to stay invested. The charts below confirm this strategy in different ways. The first chart shows how a hypothetical investment has increased since 1933, through a series of presidents from both parties. The second chart below shows the average annual returns under six different sets of election results, each reflecting positive returns.

The final chart below shows the average net flows into equities during each presidential election year and each following year. The amount of money on average flowing into equities after an election is significantly greater than the prior year, another positive for equities.

So, what can we learn from all this?  No matter what the election outcome was, whether you agree with the political views of the president or the majority of Congress, it is important to stay invested for the long term. We will experience volatility, and the first half of 2021 may be a choppy ride. If you do not stay invested, you will miss the ride — and the long-term growth.

From an investment perspective, we use the above insights to help with strategic and tactical asset allocation based on where we see the portfolio heading over the next five to seven years, with short-term adjustments along the way. We are not trying to time the market, but we will try to take advantage when we see where the market is heading. Having a well-balanced, diversified portfolio and a financial plan are keys to successful investing. The best option is to stick with a broadly diversified portfolio that can help you to achieve your own specific financial goals – regardless of market volatility.  Long-term fundamentals are what matter.

Sources: Morningstar, RBC Capital

_____

This material contains an assessment of the market and economic environment at a specific point in time and is not intended to be a forecast of future events, or a guarantee of future results.  Forward-looking statements are subject to certain risks and uncertainties.  Actual results, performance, or achievements may differ materially from those expressed or implied.  Information is based on data gathered from what we believe are reliable sources.

Using diversification as part of your investment strategy neither assures nor guarantees better performance and cannot protect against loss of principal due to changing market conditions.

Past performance is not a guarantee of future results.

The MSCI Europe Index is a free float-adjusted market capitalization weighted index that is designed to measure the equity market performance of the developed markets in Europe. The MSCI EAFE Index (Europe, Australasia, Far East) is a free float-adjusted market capitalization index that is designed to measure the equity market performance of developed markets, excluding the US & Canada. The MSCI World Index is a free float-adjusted market capitalization weighted index that is designed to measure the equity market performance of developed markets. The MSCI Emerging Markets Index is a free float-adjusted market capitalization index that is designed to measure equity market performance of emerging markets. The MSCI AC (All Country) Asia ex Japan Index is a free float-adjusted market capitalization weighted index that is designed to measure the equity market performance of Asia, excluding Japan. The Dow Jones Industrial Average is a popular indicator of the stock market based on the average closing prices of 30 active U.S. stocks representative of the overall economy. S&P 500 Index is an unmanaged group of securities considered to be representative of the stock market in general. NASDAQ Composite Index measures all NASDAQ domestic and international based common type stocks listed on The NASDAQ Stock Market. The Russell 2000 Index measures the performance of the small-cap segment of the U.S. equity universe. It is not possible to invest directly in an index.

The opinions expressed in this commentary are those of the author and may not necessarily reflect those held by Kestra Investment Services, LLC or Kestra Advisory Services, LLC.  This is for general information only and is not intended to provide specific investment advice or recommendations for any individual.  It is suggested that you consult your financial professional, attorney, or tax advisor with regard to your individual situation.

Securities offered through Kestra Investment Services, LLC (Kestra IS), member FINRA/SIPC. Investment Advisory Services offered through Kestra Advisory Services, LLC (Kestra AS) an affiliate of Kestra IS. Kestra IS and Kestra AS are not affiliated with CD Wealth Management.

2020 in the rear-view mirror

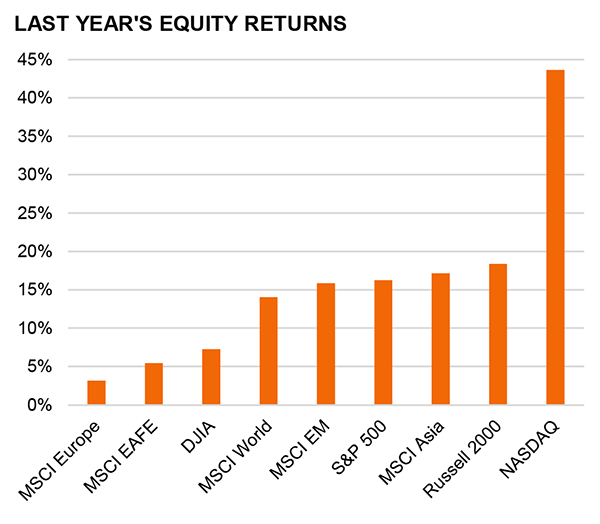
What a year 2020 was! For investors, 2020 offered good opportunities and returns — if you stayed for the ride. It was the first year since 1938 that the S&P 500 returned more than 15% while volatility was greater than 30%. The COVID-19 pandemic led to rapid losses in February and March, followed by an unprecedented recovery as both monetary and fiscal policy came to the rescue. The initial rebound in the market was led by technology stocks, more specifically, the stay-at-home stocks. At the end of the year, cyclical and small-cap stocks drove the market higher.

The Fed acted quickly and aggressively to address liquidity needs in the fixed income and bond markets, lowering the Federal Funds rates from 1.75% to zero in response to the global pandemic. The bond markets remained resilient with the help of the CARES act and the additional funds provided for state and local governments. Because of the quick action, bond default rates remained low and did not exacerbate the economic problems.

Compared to the stock market, the oil market more accurately reflected the economic reality. Crude oil fell more than 20% on the year as the pandemic caused a decline in global energy demand. Later in the year, production cuts from OPEC helped stabilize the price of oil. Gold, often considered a safe-haven asset, rose more than 20% on the year, as investors sought safety following the market decline and concerns of inflation arising with the level of increased national debt.

The economy experienced a real rollercoaster, with the biggest quarterly contraction on record in Q2, followed by the largest quarterly gain in Q3. After the shutdown in April and May, consumer saving reached the highest levels ever. Consumer spending shifted during the year as spending habits favored online shopping over brick-and-mortar stores. With the resurgence of COVID cases this winter, consumer spending has moderated going into 2021.

For 2021, growth expectations are high. We continue to highlight the following reasons why we feel the market may keep driving higher in 2021:

1. The health of the global economy and the rollout of vaccinations worldwide.

2. Technological acceleration in the world, brought about by the COVID-19 outbreak.

3. The Federal Reserve working on the premise of targeted inflation of 2% with the outlook of low interest rates for several years.

4. The government acting quicker than in past pandemics, leading to faster market recoveries.

5. The amount of cash on the sidelines waiting to be deployed on sizable market retractions.

6. The consumer savings level, which is significantly elevated compared to pre-pandemic levels.

So, what can we learn from all this? A new year almost always brings new surprises. From an investment perspective, we use the above insights to help with the strategic and tactical asset allocation and where we see the portfolio heading over the next five to seven years, with short-term adjustments along the way. We are not trying to time the market, but we will try to take advantage when we see where the market is heading. Having a well-balanced, diversified portfolio and a financial plan are keys to successful investing. The best option is to stick with a broadly diversified portfolio that can help you to achieve your own specific financial goals – regardless of market volatility. Long-term fundamentals are what matter.

Sources: FS Investments, FactSet

_____

This material contains an assessment of the market and economic environment at a specific point in time and is not intended to be a forecast of future events, or a guarantee of future results.  Forward-looking statements are subject to certain risks and uncertainties.  Actual results, performance, or achievements may differ materially from those expressed or implied.  Information is based on data gathered from what we believe are reliable sources.

Using diversification as part of your investment strategy neither assures nor guarantees better performance and cannot protect against loss of principal due to changing market conditions.

Past performance is not a guarantee of future results.

The MSCI Europe Index is a free float-adjusted market capitalization weighted index that is designed to measure the equity market performance of the developed markets in Europe. The MSCI EAFE Index (Europe, Australasia, Far East) is a free float-adjusted market capitalization index that is designed to measure the equity market performance of developed markets, excluding the US & Canada. The MSCI World Index is a free float-adjusted market capitalization weighted index that is designed to measure the equity market performance of developed markets. The MSCI Emerging Markets Index is a free float-adjusted market capitalization index that is designed to measure equity market performance of emerging markets. The MSCI AC (All Country) Asia ex Japan Index is a free float-adjusted market capitalization weighted index that is designed to measure the equity market performance of Asia, excluding Japan. The Dow Jones Industrial Average is a popular indicator of the stock market based on the average closing prices of 30 active U.S. stocks representative of the overall economy. S&P 500 Index is an unmanaged group of securities considered to be representative of the stock market in general. NASDAQ Composite Index measures all NASDAQ domestic and international based common type stocks listed on The NASDAQ Stock Market. The Russell 2000 Index measures the performance of the small-cap segment of the U.S. equity universe. It is not possible to invest directly in an index.

The opinions expressed in this commentary are those of the author and may not necessarily reflect those held by Kestra Investment Services, LLC or Kestra Advisory Services, LLC.  This is for general information only and is not intended to provide specific investment advice or recommendations for any individual.  It is suggested that you consult your financial professional, attorney, or tax advisor with regard to your individual situation.

Securities offered through Kestra Investment Services, LLC (Kestra IS), member FINRA/SIPC. Investment Advisory Services offered through Kestra Advisory Services, LLC (Kestra AS) an affiliate of Kestra IS. Kestra IS and Kestra AS are not affiliated with CD Wealth Management.

What will the new year bring?

We are excited for 2021, and we think the same positive momentum that helped us finish the year strong will continue in the weeks and months ahead. Among our reasons for optimism:

1. The improved health of the global economy and the successful worldwide rollout of the COVID-19 vaccine.

2. Rapid technological adoption and the ascension of the digital economy, caused by the pandemic.

3. The Federal Reserve’s commitment to an inflation target of 2% and the outlook of low interest rates for several years.

4. The amount of cash on the sidelines that is waiting to be deployed on sizable market retractions.

5. Consumer savings that are significantly elevated, compared to pre-pandemic levels.

6. The swift market recovery, thanks to the government’s quick actions, compared with previous financial crises (see chart below).

The markets — and the global economy — are not without risks, however. History tells us that the biggest risks in a typical year aren’t usually from out of left field, 2020 notwithstanding. Or as Mark Twain famously said, “It ain’t what you don’t know that gets you into trouble. It’s what you know for sure that just ain’t so.” 

If we look to identify the unexpected, we see the following as risks to the global markets in 2021:

1. Problems with the vaccine rollout potentially delaying the economic recovery.

2. Trade tensions with China and other countries as a new administration takes over in the White House.

3. A faster tightening of fiscal or monetary policy than is anticipated.

4. Shock to the interest rate caused by inflation or a surge in bond yields.

5. Overbuying in the stock market and valuations being stretched.

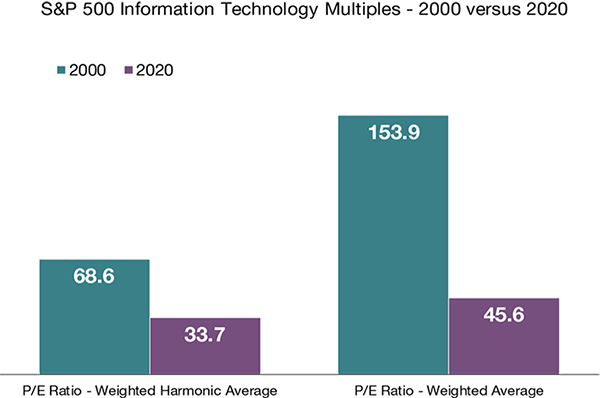
Some have begun to compare 2020 to the tech bubble of 1999-2000, but we believe the two environments are not similar for a number of reasons. The current environment has a more favorable outlook for risk assets, as the 10-year Treasury rate today is less than 1%; in January 2000 it was more than 6.5%. Inflation is low today, and that favors longer-duration assets, such as technology and other innovative companies. Also, the increase in sales of the technology companies is keeping pace with share price increases, while in 2000, share price increases soared well ahead of actual increases in sales. 

Most importantly, equity valuations are modestly higher than that of the S&P 500 today, whereas in 2000, technology multiples were more than 2 times the multiple of the S&P 500. The harmonic averages shown in the chart below remove significant outliers — giving a better sense of the value of a company — and the disparity between weighted average and harmonic average points to numerous stocks in 2000 with extreme valuations, compared to today.

The rally in technology stocks today is being driven by stronger earnings and better profitability. Innovation continues to drive the technological revolution, accelerated by the pandemic. There will continue to be winners and losers from this race, as in all races, but we think that pace of technological change will only continue to increase in the future.

So, what can we learn from all this?  Whether or not these particular risks occur, a new year almost always brings surprises. From an investment perspective, we use these trends to help with the strategic and tactical asset allocation and to define where we see the portfolio heading over the next five to seven years, with short-term adjustments along the way. We are not trying to time the market, but we will try to take advantage when we see where the market is heading. Having a well-balanced, diversified portfolio and a financial plan are the keys to successful investing. The best option is to stick with a broadly diversified portfolio that can help you achieve your own specific financial goals, regardless of market volatility. Long-term fundamentals are what matter.

Sources:  Bloomberg and Capstone Research, Factset

_____

This material contains an assessment of the market and economic environment at a specific point in time and is not intended to be a forecast of future events, or a guarantee of future results.  Forward-looking statements are subject to certain risks and uncertainties.  Actual results, performance, or achievements may differ materially from those expressed or implied.  Information is based on data gathered from what we believe are reliable sources.

S&P 500 Index is an unmanaged group of securities considered to be representative of the stock market in general.  The Dow Jones Industrial Average is a popular indicator of the stock market based on the average closing prices of 30 active U.S. stocks representative of the overall economy. NASDAQ Composite Index measures all NASDAQ domestic and international based common type stocks listed on The NASDAQ Stock Market. The Russell 2000 Index (RTY) measures the performance of the small-cap segment of the U.S. equity universe. The MSCI EAFE Index (MXEA) is an equity index which captures large and mid cap representation across 21 Developed Markets countries around the world, excluding the US and Canada. The S&P 500® Value Index (SVX), represents the value companies, as determined by the index sponsor, of the S&P 500 Index. The Index measures the performance of large-capitalization value companies in the United States. The MSCI Emerging Markets Index (MXEF) captures large and mid cap representation across 26 Emerging Markets countries. The NASDAQ-100 Index (NDX) is made up of 103 equity securities issued by 100 of the largest non-financial companies listed on the Nasdaq stock market. It is a modified capitalization-weighted index. The S&P 500® Growth Index (SGX), represents the growth companies, as determined by the index sponsor, of the S&P 500 Index. The Index measures the performance of large-capitalization growth companies in the United States. It is not possible to invest directly in an index.

Using diversification as part of your investment strategy neither assures nor guarantees better performance and cannot protect against loss of principal due to changing market conditions.

The opinions expressed in this commentary are those of the author and may not necessarily reflect those held by Kestra Investment Services, LLC or Kestra Advisory Services, LLC.  This is for general information only and is not intended to provide specific investment advice or recommendations for any individual.  It is suggested that you consult your financial professional, attorney, or tax advisor with regard to your individual situation.

Securities offered through Kestra Investment Services, LLC (Kestra IS), member FINRA/SIPC. Investment Advisory Services offered through Kestra Advisory Services, LLC (Kestra AS) an affiliate of Kestra IS. Kestra IS and Kestra AS are not affiliated with CD Wealth Management.

How can the market and the economy look so different?

Ever since stocks began to rebound from the March bottom, there has been a glaring disconnect between the impact of the coronavirus on the economy and the good mood of the stock market. Eight months later, that disconnect is as wide as ever. If one only looked at the markets, it would be difficult to tell that anything was amiss.

Investors remain in a bullish mood while the economy continues to deal with the surging spread of the coronavirus, new lockdowns in California, increased unemployment claims and a lack of stimulus from Congress for those who remain out of work. While economic numbers tell the story of the past, the stock market’s focus is on the future. The markets are not ignoring the news of the day, they simply are looking beyond it —focusing on a low interest rate environment for the next several years, a vaccine rollout that will allow the economy to reopen in 2021, a new political administration and an additional stimulus package.

It is generally understood that day-to-day market swings do not reflect what is going on in the true economy, although it may feel like they should. There are some fundamental differences between the two which can be exacerbated in short time periods, but over the long run, the stock market and the economy do tend to have a stronger correlation.

At the most basic level, the economy is the production and consumption of goods and services. It encompasses all individuals and companies, as well as the government. The stock market, however, is an exchange where the buying and selling of shares of publicly traded companies occur. Stocks trade based on future earnings; they are forward-looking in nature. The earnings expectations for the top large-cap companies are high, and we should expect these companies to face volatility in the near future with growing regulatory pressure, ad-spending boycotts, the upcoming runoff election and potential corporate tax changes.

Small businesses are known to be the lifeblood of the U.S. economy, but they do not represent the stock market. According to the U.S. Small Business Administration, small businesses make up about half of private sector employment and 44% of U.S. economic activity. They represent over 99% of U.S. employer firms and create two-thirds of new jobs.

Less than one third of Americans work for publicly traded companies. That means the U.S. stock market represents only a portion of U.S. employment and does not entirely reflect how economic gains are distributed throughout the economy. The composition of the stock market also is different from the real economy. We see this in the weighting of major indexes, like the S&P 500, in that the largest stocks have the biggest influence. Right now, the largest five companies, all of them growth technology companies, make up 25% of the S&P 500. 

So, what can we learn from all this?  

Basing investment decisions on the current economy instead of where it is headed can often lead to incorrect assumptions about the direction of the stock market. Trying to time the market is extremely difficult and can cause poor investment performance. As we near the end of 2020, we view more risk being out of the market than in the market. Riding out future market volatility, in addition to having a diversified portfolio, means staying the course. 

It all starts with a solid financial plan for the long run that understands the level of risk that is acceptable for each client. With regards to investments, we believe in diversification and having different asset classes that allow you to stay invested. The best option is to stick with a broadly diversified portfolio that can help you to achieve your own specific financial goals – regardless of market volatility.  Long-term fundamentals are what matter.

_____

This material contains an assessment of the market and economic environment at a specific point in time and is not intended to be a forecast of future events, or a guarantee of future results.  Forward-looking statements are subject to certain risks and uncertainties.  Actual results, performance, or achievements may differ materially from those expressed or implied.  Information is based on data gathered from what we believe are reliable sources.

S&P 500 Index is an unmanaged group of securities considered to be representative of the stock market in general.  The Dow Jones Industrial Average is a popular indicator of the stock market based on the average closing prices of 30 active U.S. stocks representative of the overall economy. NASDAQ Composite Index measures all NASDAQ domestic and international based common type stocks listed on The NASDAQ Stock Market. The Russell 2000 Index (RTY) measures the performance of the small-cap segment of the U.S. equity universe. The MSCI EAFE Index (MXEA) is an equity index which captures large and mid cap representation across 21 Developed Markets countries around the world, excluding the US and Canada. The S&P 500® Value Index (SVX), represents the value companies, as determined by the index sponsor, of the S&P 500 Index. The Index measures the performance of large-capitalization value companies in the United States. The MSCI Emerging Markets Index (MXEF) captures large and mid cap representation across 26 Emerging Markets countries. The NASDAQ-100 Index (NDX) is made up of 103 equity securities issued by 100 of the largest non-financial companies listed on the Nasdaq stock market. It is a modified capitalization-weighted index. The S&P 500® Growth Index (SGX), represents the growth companies, as determined by the index sponsor, of the S&P 500 Index. The Index measures the performance of large-capitalization growth companies in the United States. It is not possible to invest directly in an index.

Using diversification as part of your investment strategy neither assures nor guarantees better performance and cannot protect against loss of principal due to changing market conditions.

The opinions expressed in this commentary are those of the author and may not necessarily reflect those held by Kestra Investment Services, LLC or Kestra Advisory Services, LLC.  This is for general information only and is not intended to provide specific investment advice or recommendations for any individual.  It is suggested that you consult your financial professional, attorney, or tax advisor with regard to your individual situation.

Securities offered through Kestra Investment Services, LLC (Kestra IS), member FINRA/SIPC. Investment Advisory Services offered through Kestra Advisory Services, LLC (Kestra AS) an affiliate of Kestra IS. Kestra IS and Kestra AS are not affiliated with CD Wealth Management.