What Investors Should Consider as Debt and Stocks Keep Climbing

It’s been just a few weeks since the S&P 500 reached new all-time highs, and as of today, it remains less than 2% below that level. For many investors, highs like these feel like a warning sign that a correction is due. If you listen to the average investor, however, you might think stocks were nowhere near record levels.

Retail investors have been heading for the exits, selling at the end of July at one of the fastest rates we have seen all year. That kind of selling can be difficult in the moment, but it also tends to shake out weaker investors, making it easier for stocks to continue moving higher.

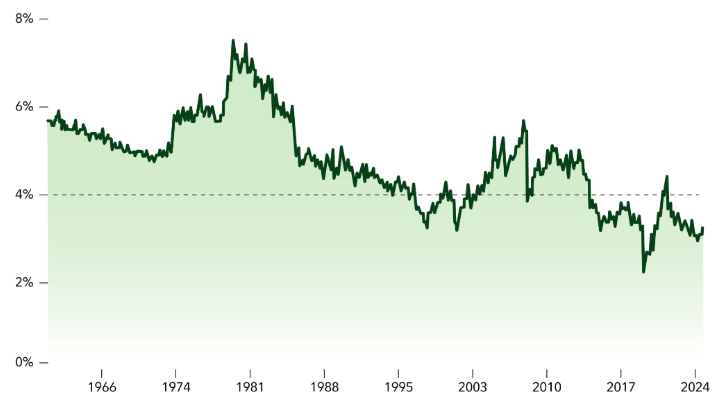
The big story is that the 30-year Treasury reached levels not seen since 2007, causing markets to worry that higher yields could eventually weigh on the bull market. It is not surprising that long-term yields are higher, as we remain in an inflationary growth environment.

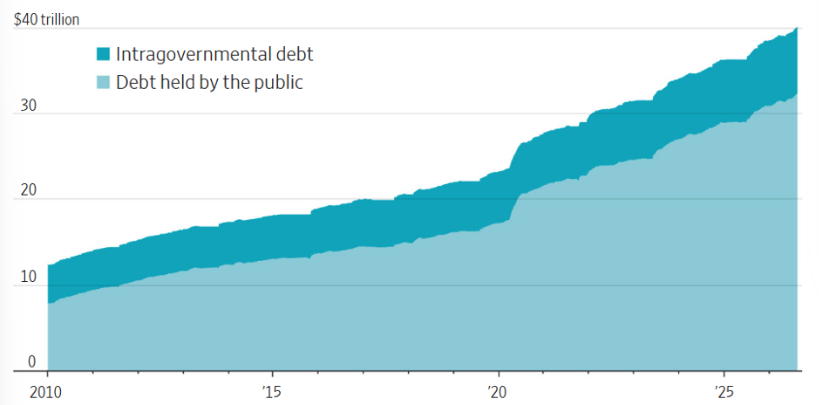
At the same time, U.S. government debt crossed the $40 trillion mark, doubling in just nine years. We now pay an annualized $1.1 trillion in interest on our debt, which exceeds the Defense Department’s entire current budget. For years, we have heard calls that higher debt would lead to a market crash, but it has not happened yet.

The balance sheets of corporate America and consumers remain healthy, and that matters greatly to both the economy and the stock market. While our national debt has doubled over the past nine years, household net worth has nearly doubled over the same period.


U.S. Public Debt Outstanding

Chart showing the growth of the national debt since 2010.
Source: Treasury Department

Bull markets have typically ended with euphoria, not anxiety. To many investors, investing in stocks at record highs can be very uncomfortable; their thinking is that a high must be followed by a fall.

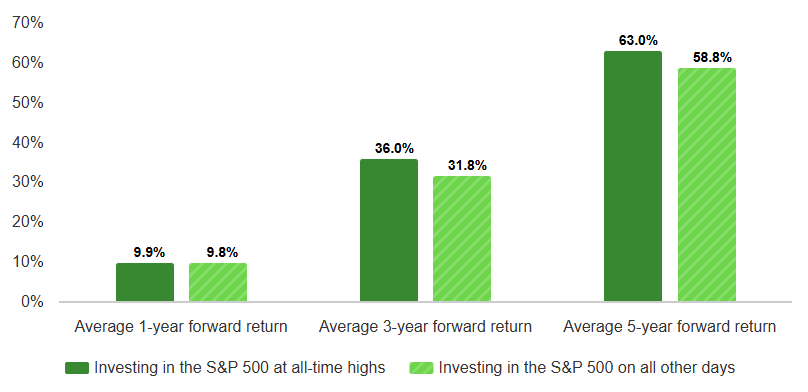
The record says otherwise, as shown in the chart below. Since 1920, investing on a day when the S&P 500 closed at an all-time high has produced average forward returns of nearly 10% over the following year, 36% over three years, and 63% over five years. These returns are better than those achieved by investing on all other days, outperforming both three- and five-year time horizons by nearly 4 percentage points.

That is a substantial difference and not just statistical noise.


All-Time Highs vs. All Other Days

Average S&P 500 returns investing in all-time highs vs. all other days since 1920

Chart showing the effect of investing  in all-time highs, based on S&P 500 returns with and without all-time highs included.
Past performance is no guarantee of future results. Forward returns calculated using daily data. It is not possible to invest directly in an index. All market indices are unmanaged. Source: FactSet, as of June 30, 2026.

Why is this the case? Doesn’t it make sense that what goes up must come down?

Market highs are based on fundamentals, not only on momentum. You can argue that momentum takes stocks to new highs, and that may be true, but sustained market strength requires fundamental support.

1. Corporate earnings remain strong. For the second quarter, earnings were very strong, with most companies in the S&P 500 outperforming analyst estimates, and full-year profits are now expected to grow at double-digit rates in both 2026 and 2027. Stock prices follow earnings.

2. The economy continues to expand. The real economy has been more resilient than the headlines suggest. Manufacturing activity has expanded for seven consecutive months, and the ISM Manufacturing Index recently reached a four-year high.

3. The labor market is holding steady. Unemployment remains low at 4.1%. Permanent job losses have not surged. While nonfarm payroll growth has softened, the pattern in the job market appears to be a low-hire, low-fire slowdown rather than a meaningful deterioration in labor market conditions.

Strong earnings, expanding manufacturing activity, and a labor market that is holding steady are not the signs of an economy heading into a recession or a market on the verge of a large correction.


What could cause the market to falter?

The main risks to the market are monetary policy, valuations, and a potential slowing of artificial intelligence growth and spending.

The Fed is in a tough spot, having held interest rates steady for most of the year. The Federal Reserve Board is becoming more divided, with three members voting for a rate cut.

President Trump would like to see interest rates move lower. However, with inflation running well above its target rate, the Fed has reason to remain restrictive and avoid reducing interest rates, even as growth moderates. The softness in payrolls strengthens the case for lower rates, making the Fed’s job even more difficult as it balances higher inflation with softer labor market data.

Valuations are a risk because today’s higher stock prices depend in part on continued earnings growth. Should corporate earnings start to stall, investors may be less willing to pay those prices, putting more pressure on the market.

Lastly, if AI spending weakens and more evidence emerges of slower monetization, earnings expectations could be challenged. This could potentially unsettle the strong rally in AI-related stocks, which remain a significant part of the overall market. Ultimately, we believe these factors could lead to greater market turbulence but do not undermine the longer-term trend of underlying market strength.

The market fundamentals supporting current market highs are real, but so are the risks of investing. Record highs by themselves are not a good reason to sell. Our focus continues to be on managing market volatility through portfolio diversification, rather than avoiding equities simply because prices are high.


Promo for an article titled Understanding How the AI Investment Ecosystem is Changing.

The CD Wealth Formula

We help our clients reach and maintain financial stability by following a specific plan, catered to each client.

Our focus remains on long-term investing with a strategic allocation while maintaining a tactical approach. Our decisions to make changes are calculated and well thought out, looking at where we see the economy heading. We are anticipating and moving to those areas of strength in the economy and in the stock market. 

We will continue to focus on the fact that what really matters right now is time in the market, not out of the market. That means staying the course and continuing to invest, even when the markets dip, to take advantage of potential market upturns. We continue to adhere to the proven disciplines of diversification, periodic rebalancing, and forward-looking strategies, while avoiding reliance on stale retrospective data.

It is important to focus on the long-term goal, not on one specific data point or indicator. Long-term fundamentals are what matter. In markets and moments like these, it is essential to stick to the financial plan. Investing is about following a disciplined process over time.

Sources: Fidelity, U.S. Treasury

Bull Markets, SpaceX — and the Case for Patience in Investing

Stocks continue to move higher, even amid war in the Middle East, higher inflation, and 30-year Treasury yields at their highest levels since the Great Financial Crisis. The S&P 500 reached another all-time high last week — its 25th this year — as the current bull market approaches its fourth anniversary in October.

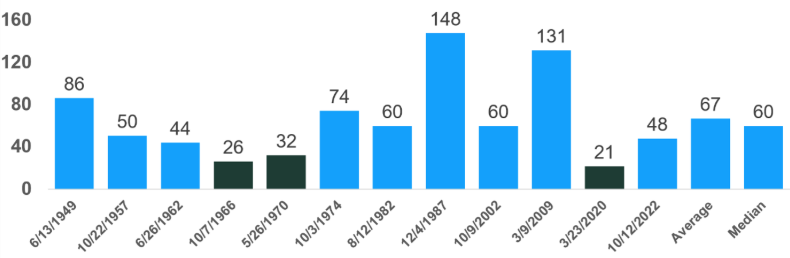
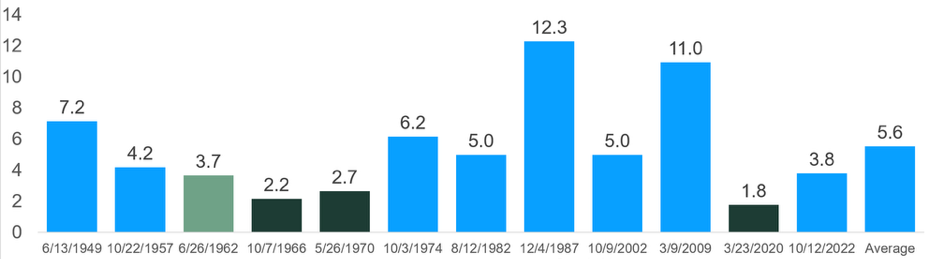
Bull markets have historically lasted longer than many investors realize. As the chart below illustrates, there can be many more years of gains after bull markets make it past three years. Since 1949, only three bull markets have lasted less than three years, and only two that surpassed the three-year mark failed to continue beyond five years.


Bulls That Get to 3 Usually Last Many More Years

Length of bull markets in years

Chart showing the length of bull markets since 1949.
Sources: Carson Investment Research, FactSet 8/7/26

Obviously, there are no guarantees that the current bull market will reach the five-year mark. But if you look at S&P 500 earnings, it is difficult to see a bear market on the horizon. Companies in the index are on track to achieve their seventh consecutive quarter of double-digit year-over-year earnings growth.

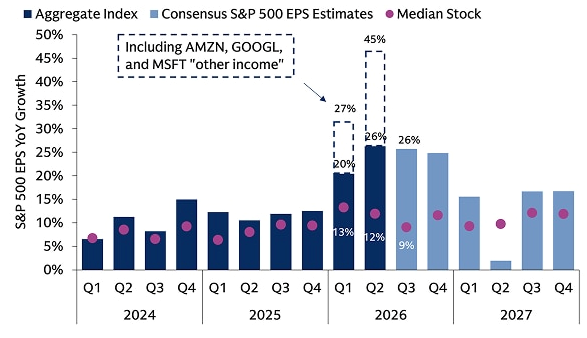
S&P 500 earnings per share (EPS) growth is tracking 45% year over year for the second quarter. For the median company, EPS growth is tracking 12%, well ahead of the 9% estimate at the start of the quarter. This reflects broad-based earnings strength across the index, not just among technology companies.


Exceptional Earnings

Chart showing earnings growth during the current bull market and projected growth through 2027.
Source: GS Global Investment Research and GS Asset Management. As of August 5, 2026. Chart shows S&P 500 year-over-year growth, with the bars representing EPS growth for the aggregate index and the squares representing EPS growth for the median stock in the index. “EPS” refers to earnings per share. “YoY” refers to year-over-year. The economic and market forecasts presented herein are for informational purposes as of the date of this presentation. There can be no assurance that the forecasts will be achieved.

SpaceX remains one of the most talked-about and frequently asked-about stocks in the current market. SpaceX went public June 12 in one of the highest-profile IPOs of all time. The company raised more than $85 billion, making it the largest IPO in history.

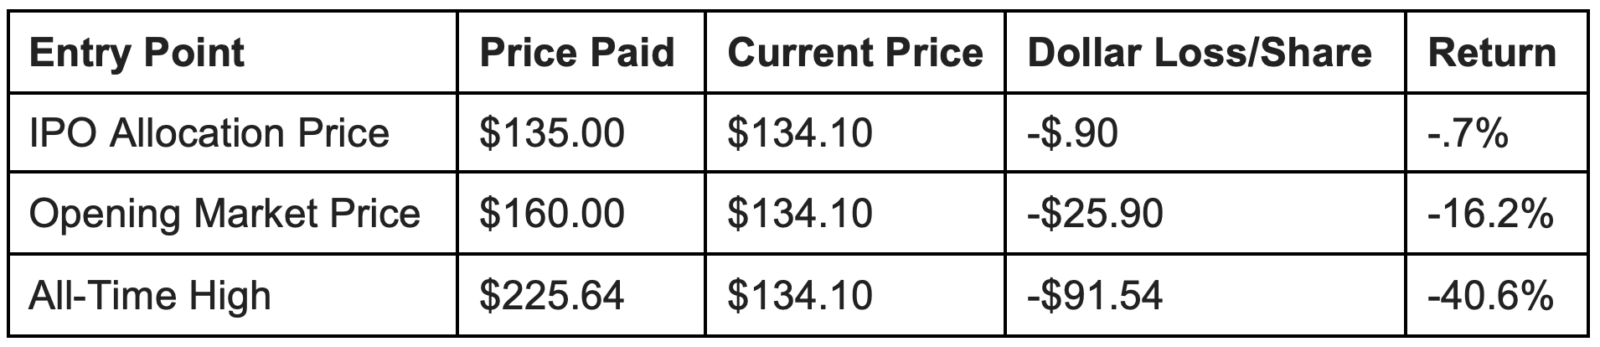
Shares soared following the IPO, climbing from the $135 offering price to more than $220 before eventually coming back down to earth. The stock hit a low of $104.83 in early August, a decline of more than 50% from its all-time high, before climbing back above its $135 offering price this week.

Table showing SpaceX valuations since its IPO.

As we wrote prior to the SpaceX IPO, major technology companies have often experienced significant drawdowns in the months following their public debuts. According to data compiled by a University of Florida professor, nearly half of all large IPOs between 1975 and 2021 were still trading below their offering price on their third anniversary.

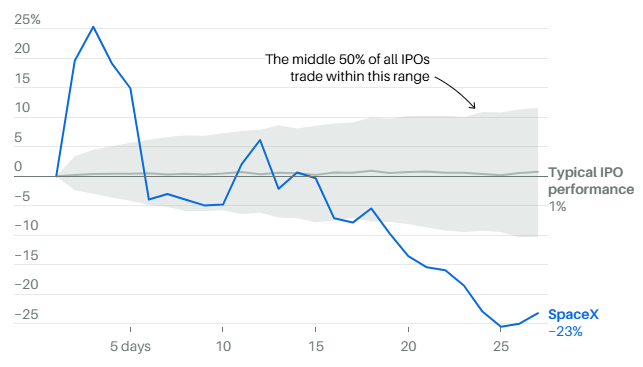
According to Barron’s, SpaceX has performed worse than 90% of U.S. IPOs with a market capitalization greater than $1 billion since July 2009. During its first 27 trading days, SpaceX declined 23% from its day-one closing price, compared with an average gain of 0.8% for other IPOs over the same period.


Return Since IPO, Indexed to First Close

Chart showing how IPOs have performed in their first 27 days.
Note: Typical IPO performance represents median return of 955 stocks launched since 2009 over the first 27 trading days. Source: FactSet.

Being down from its IPO price does not mean a stock will never recover or go on to become a great performer. For example, META (Facebook) declined more than 54% from its offering price and has gone on to average approximately 23% annual returns since 2012. The turnaround was far from immediate, however. It took more than a year for the stock to climb above its first-day closing price, in part because of the flood of newly unlocked shares entering the market as lockup periods expired.

History suggests that patience can be rewarded. As investors, we are often better served by giving the public markets time to assess a company’s earnings power, competitive advantages, and long-term prospects.

SpaceX is an extraordinary company, but our investment decisions are driven by a disciplined process — not excitement surrounding a particular name.

We must also determine whether its valuation, risk profile, growth expectations, and overall opportunity set offer an attractive risk-adjusted return for our clients. At this stage, we believe it is still too early to justify an investment. While we recognize the company’s leadership in space exploration and satellite communications, we believe its current valuation reflects very optimistic expectations and leaves limited margin for error.

History has shown that many highly anticipated IPOs and newly public companies experience significant declines as investors reassess growth expectations and valuations after the initial enthusiasm fades. Our process considers valuation, risk, competitive positioning, growth prospects, and portfolio fit, and at this time, SpaceX does not meet our investment criteria.

We continue to monitor the company closely and would be willing to invest if the risk-reward profile becomes more attractive in the future.

A great company does not always make a great investment at today’s price.


Promo for an article titled Understanding How the AI Investment Ecosystem is Changing.

The CD Wealth Formula

We help our clients reach and maintain financial stability by following a specific plan, catered to each client.

Our focus remains on long-term investing with a strategic allocation while maintaining a tactical approach. Our decisions to make changes are calculated and well thought out, looking at where we see the economy heading. We are anticipating and moving to those areas of strength in the economy and in the stock market. 

We will continue to focus on the fact that what really matters right now is time in the market, not out of the market. That means staying the course and continuing to invest, even when the markets dip, to take advantage of potential market upturns. We continue to adhere to the proven disciplines of diversification, periodic rebalancing, and forward-looking strategies, while avoiding reliance on stale retrospective data.

It is important to focus on the long-term goal, not on one specific data point or indicator. Long-term fundamentals are what matter. In markets and moments like these, it is essential to stick to the financial plan. Investing is about following a disciplined process over time.

Sources: Barrons, FactSet, Goldman Sachs, Schwab

Here’s What Drove the Markets’ Rally in the First Half of 2026

We are now in the dog days of summer, and the first half of 2026 is behind us. It has been a remarkable six months for investors. Markets navigated the continued AI boom, conflict in the Middle East, and a sharp first-quarter correction before staging a powerful rally that pushed major indices to new all-time highs by the end of June.

Markets sold off as investors weighed the escalating conflict between the U.S. and Iranhigher oil prices, and increased geopolitical uncertainty. At one point, the NASDAQ and S&P 500 fell nearly 10% from their highs. As tensions eased, stocks rebounded sharply, led by companies benefiting from the continued growth of artificial intelligence.

Rather than the Magnificent Seven stocks leading the way as they had in recent years, gains were led by companies supplying AI infrastructure, such as semiconductor, memory, and data center businesses. In fact, the Magnificent Seven were down more than 3% during the first half of the year.

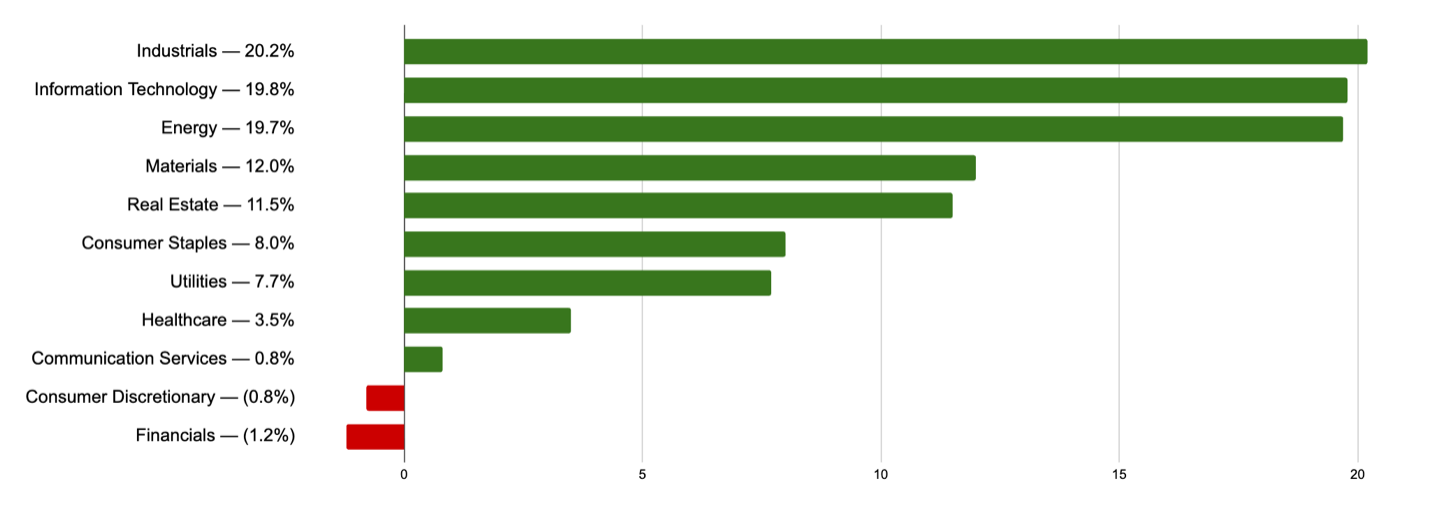
Corporate earnings proved to be the primary reason stocks overcame geopolitical concerns, with double-digit earnings for S&P 500 helping to justify higher valuations. The rally was quite broad-based, with only two of the 11 sectors in the S&P 500 finishing the first half of the year with negative returns. Energy stocks performed similarly to technology stocks due to a jump in oil prices from the Middle East conflict.


S&P 500 Sector Performance
(January-June 2026)

Bar chart showing S&P 500 sector performance in the first half of 2026.

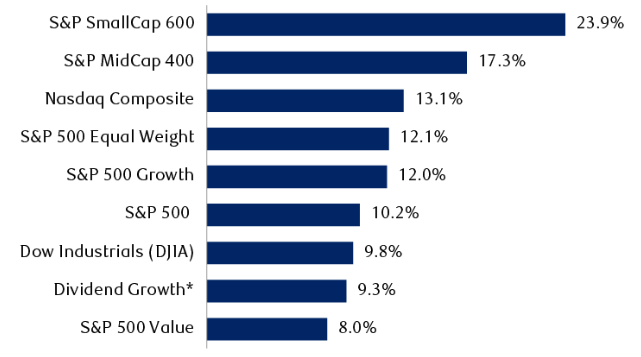
Small-cap stocks, which tend to do well when manufacturing and job-growth trends are strong, led all major indexes with a gain of more than 20% during the first half of the year. Mid-cap stocks also benefited from the AI-driven data center buildout, as well as relatively inexpensive valuations compared to large-cap equities.

International stocks continued to show the strength they demonstrated in 2025, generating similar returns to U.S. stocks during the first half of the year. Emerging markets have been among the best-performing asset classes this year, led by South Korea and Taiwan, as demand has strengthened for semiconductors and other technologies tied to the AI boom.


Strong Returns for Equity Indexes

First-half 2026 total returns of key indexes and styles (includes dividends)

Bar chart showing strong returns for equity indexes in the first half of 2026.
* Dividend growth based on S&P 500 Dividend Aristocrats Index. Source: RBC Wealth Management, Bloomberg. Data range: 12/31/25-6/30/26.

The U.S. economy remained resilient in the first half of the year despite inflation and geopolitical uncertainty. Capital investment remained strong, especially in areas tied to artificial intelligence, while unemployment remained at 4.3%, near historical lows.

Consumers generally proved to be resilient despite higher prices. However, lower-income consumers are feeling the strain, and the divide between the haves and the have-nots is growing wider. Higher-income earners and consumers have benefited from a strong stock market and have been able to spend more on travel and luxury goods, while lower-income earners have not shared in the benefit of rising asset values.

Higher oil prices have pushed up the cost of many goods and contributed to higher prices for transportation and other services. Inflation also led to higher yields for the 10-year and 30-year Treasury bonds, with the 30-year breaching 5% during the first half of the year. At the start of the year, investors widely expected the Federal Reserve to reduce interest rates. Today, expectations have shifted, with many anticipating that the Fed will keep rates higher for longer or even increase rates if inflation continues to move higher.


In May, Kevin Warsh replaced Jerome Powell as chair of the Federal Reserve Bank, adding uncertainty around the future direction of monetary policy. The longer inflation remains higher, the greater the impact on economic growth. Crude prices have fallen significantly from their highs, and gasoline prices have dropped, helping the consumer.

This bodes well for the second half of the year. AI will remain at the forefront of investors’ minds, and we expect some market jitters as the November midterm elections draw near. However, elections have historically been more noise than substance and do not change our long-term outlook for the market.

We do not know if we are in the middle of an AI bubble — and if we are, when it may burst. Bubbles typically last longer than investors expect. The S&P 500 has doubled since the end of 2022, yet only one-fourth of that expansion is due to multiple expansion (valuations), while roughly three-fourths has been driven by earnings growth and dividends. The key remains staying diversified while maintaining exposure to technology stocks and the AI trade.

While uncertainty will undoubtedly remain, our approach does not change. We look forward to helping you stay focused on your long-term goals through the remainder of 2026.

The CD Wealth Formula

We help our clients reach and maintain financial stability by following a specific plan, catered to each client.

Our focus remains on long-term investing with a strategic allocation while maintaining a tactical approach. Our decisions to make changes are calculated and well thought out, looking at where we see the economy heading. We are anticipating and moving to those areas of strength in the economy and in the stock market. 

We will continue to focus on the fact that what really matters right now is time in the market, not out of the market. That means staying the course and continuing to invest, even when the markets dip, to take advantage of potential market upturns. We continue to adhere to the proven disciplines of diversification, periodic rebalancing, and forward-looking strategies, while avoiding reliance on stale retrospective data.

It is important to focus on the long-term goal, not on one specific data point or indicator. Long-term fundamentals are what matter. In markets and moments like these, it is essential to stick to the financial plan. Investing is about following a disciplined process over time.

Sources: Carson, CNBC, Fidelity, Kestra Investment Management, RBC

What Investors Are Paying Attention to in the First Half of 2026

As we approach the halfway point of the year, a review of our most-read articles offers a telling look into what has been on investors’ minds: volatility, private credit, and Treasury yields — along with the impact of geopolitical events.

While the topics varied, the underlying questions were often the same:

What matters? What doesn’t? Does this change anything for my plan?

Successful investing has never been about reacting to every headline. It requires understanding what is happening, putting it into perspective, and maintaining focus on long-term objectives.

Below are the pieces that have generated the most interest from readers so far this year.

Most-read newsletter articles

• Volatility Has Returned to the Market. Here’s How to Think About It.
Markets may react to headlines and emotions, but over the long term, stocks revert to fundamentals.

• Trump Accounts Are Coming This Year. Here’s What You Should Know.
If you plan to grow your family in the next three years, coordinating Trump accounts with your overall strategy may help maximize impact.

• How Do Successful Investors Respond to Market Volatility?
Long-term outcomes are driven far more by Investors’ behaviors than by market conditions.

• What Investors Should Know About the Coming Wave of IPOs
SpaceX is expected to become the first of three hugely anticipated initial public offerings this year, with Anthropic and OpenAI to follow.

• From Oil Spikes to Market Recovery: Here’s What History Shows
Markets have historically recovered quickly after oil supply shocks — often within months.

Most-read website articles

• What’s Happening With Private Credit — and How Could It Affect Investors?
The market is experiencing stress from high-profile redemption requests and mounting concerns over loan quality.

• Understanding the 10-Year Treasury and Its Impact on Your Investments
It influences all borrowing costs, from interest rates on bonds to mortgage rates and student loans.

• Stocks in Correction Mode: Here’s What Market History Tells Us
Market corrections feel different every time, and they never feel normal – but they are.

• Here’s Why Your Brokerage Account May Be Safer Than Your Bank
We make sure your assets and information are protected by some of the most advanced cybersecurity tools in the financial industry.

• From Oil Spikes to Market Recovery: Here’s What History Shows
Markets have historically recovered quickly after oil supply shocks — often within months.


Promo titled Download and Share: How We Manage Money.

The CD Wealth Formula

We help our clients reach and maintain financial stability by following a specific plan, catered to each client.

Our focus remains on long-term investing with a strategic allocation while maintaining a tactical approach. Our decisions to make changes are calculated and well thought out, looking at where we see the economy heading. We are anticipating and moving to those areas of strength in the economy and in the stock market. 

We will continue to focus on the fact that what really matters right now is time in the market, not out of the market. That means staying the course and continuing to invest, even when the markets dip, to take advantage of potential market upturns. We continue to adhere to the proven disciplines of diversification, periodic rebalancing, and forward-looking strategies, while avoiding reliance on stale retrospective data.

It is important to focus on the long-term goal, not on one specific data point or indicator. Long-term fundamentals are what matter. In markets and moments like these, it is essential to stick to the financial plan. Investing is about following a disciplined process over time.

What Investors Should Know About the Coming Wave of IPOs

After nine straight weeks of gains, markets sold off sharply at the end of last week. The Nasdaq finished down more than 4% on Friday, while the S&P 500 fell more than 2.5%. During its run, the S&P 500 had gained almost 20% before falling short of its first 10-week winning streak since 1985.

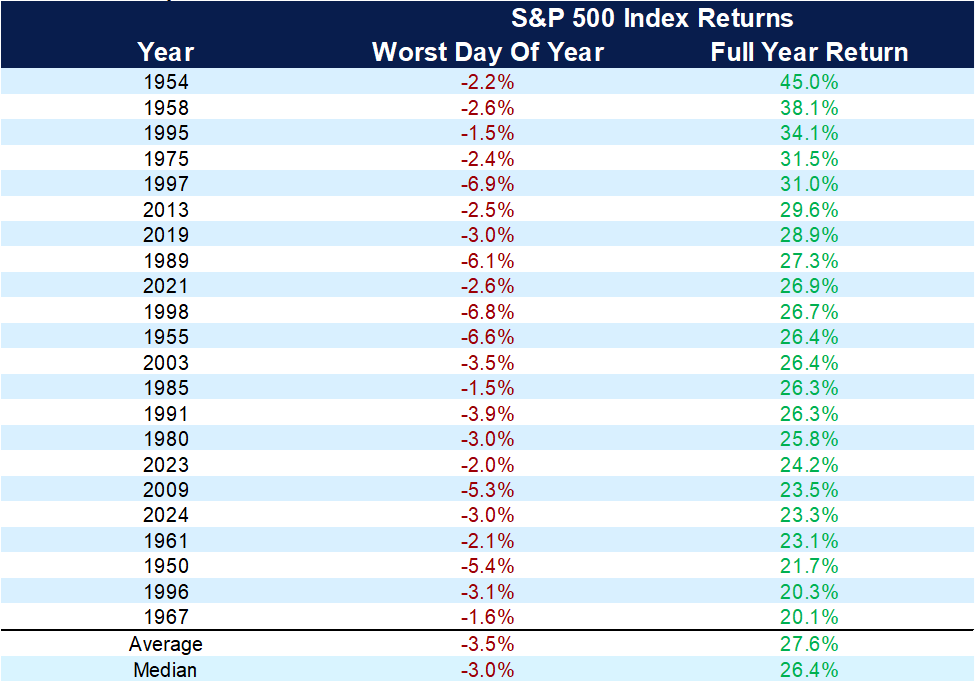
Friday was a reminder that even in strong years, difficult days can and will happen; markets don’t move in a straight line. The chart below shows that when the S&P 500 has been up more than 20% in a calendar year, the average worst day has been a decline of roughly 3%, with some pullbacks approaching 7%.

Large down days are a normal part of investing and occur more often than many investors realize.


Even Years That Gain 20% Have a Bad Day

Chart showing numbers reflecting the worst day of each year and full return from each year that ended with a market gain of more than 20%.
Sources: Carson Investment Research, FactSet 3/10/2025

Big Days Ahead for IPOs

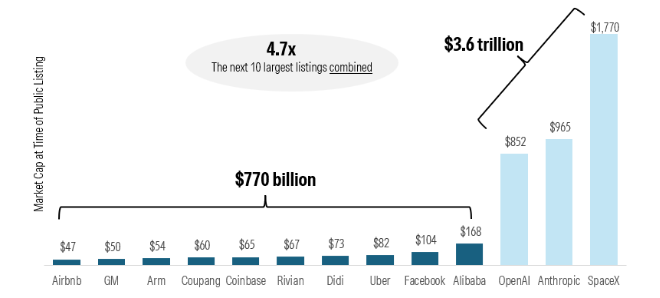
On Friday, SpaceX is expected to become the first of three massively anticipated initial public offerings this year, with Anthropic and OpenAI expected to follow. Together, these three offerings are projected to carry a combined market capitalization of roughly $3.6 trillion — nearly five times the combined value of the 10 largest IPOs in history at the time they came public.

SpaceX’s IPO is unique in several ways. Rather than offering shares within a pricing range and allowing demand to determine the final offering price, the company is reportedly using a “take-it-or-leave-it” price of $135 per share. In addition, approximately 30% of the shares being offered are expected to be allocated to retail investors, well above the typical 5-10% allocation seen in most IPOs.


Largest Collection of Public Offerings Ever

Market cap at time of listing (billions)

Chart showing the IPOs of the expected big three vs. the totals of the previous 10 largest.
Sources: Morningstar Direct, PitchBook, CNBC. Data as of June 2026. References to specific securities not an offer to buy or sell. For illustrative purposes only.

There is tremendous hype surrounding the SpaceX IPO, and it will be interesting to see how the market reacts. The offering is expected to be the largest IPO in history, with an estimated market capitalization of $2 trillion. (Market capitalization is the number of shares outstanding multiplied by share price.) That number would surpass Saudi Aramco’s 2019 offering, meaning Elon Musk is anticipated to become the world’s first trillionaire.

Despite the excitement, SpaceX reportedly lost nearly $5 billion last year, meaning much of the investment case rests on future potential rather than current profitability. That said, investors should remember that some of today’s most successful companies, including Amazon, operated at losses for many years before ultimately becoming highly profitable businesses.

History also suggests that chasing IPOs — particularly during the initial days after they begin trading — is rarely a prudent long-term investment strategy.

The odds are often stacked against new public investors. While many IPOs experience an initial “pop” driven by hype, limited share availability, and media attention, IPOs historically have tended to underperform the broader market over longer periods of time.

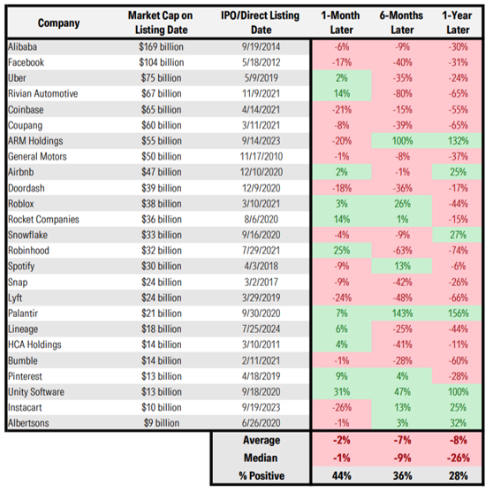
The table below highlights several well-known technology companies that went public and, on average, experienced drawdowns of roughly 60% from their IPO prices during the first year. Among the 25 largest IPOs since 2010, average returns after one month, six months, and one year have all been negative, with fewer than 30% posting positive returns one year after going public.


Buyer Beware

Large public offerings usually are better for sellers than buyers — at least initially

Chart showing performance of large IPOs at one month, six moths and one year.
Source: Morningstar Direct. Data includes IPOs and direct listings from 2010 to 2024. Past performance is no guarantee of future results. References to specific securities not an offer to buy or sell.

What Investors Should Keep in Mind

SpaceX, OpenAI, and Anthropic may eventually make their way into investor portfolios whether investors choose to purchase the stocks directly or not. The Nasdaq recently adopted a fast-entry rule that allows newly public mega-cap companies to join the Nasdaq-100 after just 15 trading days.

The S&P, however, has said it will maintain its existing eligibility requirements, including a 12 month waiting period and profitability standards before a company can be added to the S&P 500 Index.

SpaceX, OpenAI, and Anthropic may ultimately prove to be remarkable public companies. However, that does not necessarily mean they will be good investments at their IPO prices.

FOMO is a very real emotion in investing, and many investors fear they may be missing the next Tesla or Nvidia.

Facebook and Amazon are good examples. Facebook struggled after its IPO, falling nearly 50% within its first year as a public company before eventually becoming one of the best-performing and most profitable companies of the last decade.

The key distinction is that many of these IPOs may indeed be exceptional businesses, but they are already being valued as exceptional businesses from day one. The market will closely watch how SpaceX trades following its IPO on Friday, as it could help set the tone for technology stocks in the weeks ahead.


Promo for an article titled How Do Successful Investors Respond to Market Volatility?

The CD Wealth Formula

We help our clients reach and maintain financial stability by following a specific plan, catered to each client.

Our focus remains on long-term investing with a strategic allocation while maintaining a tactical approach. Our decisions to make changes are calculated and well thought out, looking at where we see the economy heading. We are anticipating and moving to those areas of strength in the economy and in the stock market. 

We will continue to focus on the fact that what really matters right now is time in the market, not out of the market. That means staying the course and continuing to invest, even when the markets dip, to take advantage of potential market upturns. We continue to adhere to the proven disciplines of diversification, periodic rebalancing, and forward-looking strategies, while avoiding reliance on stale retrospective data.

It is important to focus on the long-term goal, not on one specific data point or indicator. Long-term fundamentals are what matter. In markets and moments like these, it is essential to stick to the financial plan. Investing is about following a disciplined process over time.

Sources: Carson, CNBC, Morningstar

A Volatile Year So Far: Oil Prices, Market Highs, and Inflation Risks

As we approach Memorial Day and the start of summer, it is a good time to look back on the first five months of the year for some perspective. The markets experienced volatility, driven by the war in Iran that pushed oil prices higher and renewed concerns about inflation, which caused the markets to decline.

The S&P nearly fell into correction territory — a drop of more than 10% in value. Just like last year, however, stocks rebounded sharply in a V-shaped recovery, with the index reaching new all-time highs in April and May.

Why did the market rebound so quickly?

As the saying goes, it’s the economy. In the first quarter, the U.S. economy continued to grow, powered by consumption and spending on AI technologies. Manufacturing activity increased, showing that companies remain confident in the economic outlook.

While we have seen some large companies laying off employees, the job market overall remains steady, with unemployment holding close to 4.3%. These are not signs of an imminent recession.

That said, this does not mean the coast is clear. Tensions remain high in the Middle East, and as a result, oil prices remain elevated, keeping inflation higher.

For some, the thought of $100 oil prices and a crisis in the Middle East evokes memories of gas lines in the 1970s. While no one likes paying more at the pump, today’s households are less sensitive to higher energy costs, thanks to higher incomes, better energy efficiency, and stronger personal balance sheets.

Energy consumption as a percentage of income is less than half of what it was in the late 1970s and early 1980s. What matters most now is how long oil prices remain elevated. Oil futures are predicting that by the end of the year, the price of oil will return to the $80s, a far cry from the peak of $120.


Energy consumption as a percent of income is near all-time lows

Sources: Haver Analytics, Fidelity Investments. U.S. household personal incomes and U.S. household energy expense based on the Personal Consumption Expenditures Index. Data as of March 2, 2026.

One of the most important drivers of market returns is corporate earnings. While valuations may be elevated in certain sectors, prices alone don’t indicate a prolonged downturn in the market. In the first quarter of 2026, both the U.S. and emerging markets saw year-over-year earnings growth in the double digits.

About 80 percent of the companies in the S&P reported positive earnings surprises, revenue growth, and healthy profits. Analysts are predicting strong potential earnings growth for the second half of 2026.

Why? Because the consumer has remained resilient in light of higher oil prices, supported by positive wage growth, more money per household, and tax cuts from the Big Beautiful Bill.

We recognize that lower-income households feel greater pressure from higher inflation. However, on average, consumers aren’t overly stretched. The amount of debt consumers have today is far less than what we saw during the financial crisis of 2008–2009.

Another positive economic indicator is manufacturing activity. The Purchasing Manager’s Index (PMI), which measures current and future business conditions within manufacturing, has moved into expansion territory — indicating that companies are confident demand will continue.

Outside of the U.S., companies also are reporting improved manufacturing conditions, following nearly three years of contraction. Large companies continue to invest in infrastructure, especially in the AI space, such as data centers, chips, and electricity. This has a trickle-down effect on the economy as well.


Promo for an article titled From Oil Spikes to Market Recovery: Here's What History Shows.

Watching inflation closely

At the same time, it is important to balance these positive signals with the risks we continue to monitor closely. Inflation remains one of the biggest concerns. The most recent data shows that consumer prices — excluding food and energy — are moving above 3%, well above the Fed’s 2% target rate.

If oil prices remain elevated, inflationary pressures could persist, potentially leading the Fed to keep interest rates higher for longer or even raise them further. That could place additional pressure on mortgage rates and credit card rates while also increasing volatility in equity markets.

In this more uncertain backdrop, maintaining perspective becomes especially important; remember that volatility is not in and of itself a change in the economy or the stock market. AI has the potential to boost productivity and corporate profits, even in the face of higher inflation, but it also can disrupt the job market and business plans.

As always, it is vital to stay focused on the long-term plan — and not to get caught up in the noise if and when volatility returns to the market.


Promo for an article titled How Do Successful Investors Respond to Market Volatility?

The CD Wealth Formula

We help our clients reach and maintain financial stability by following a specific plan, catered to each client.

Our focus remains on long-term investing with a strategic allocation while maintaining a tactical approach. Our decisions to make changes are calculated and well thought out, looking at where we see the economy heading. We are anticipating and moving to those areas of strength in the economy and in the stock market. 

We will continue to focus on the fact that what really matters right now is time in the market, not out of the market. That means staying the course and continuing to invest, even when the markets dip, to take advantage of potential market upturns. We continue to adhere to the proven disciplines of diversification, periodic rebalancing, and forward-looking strategies, while avoiding reliance on stale retrospective data.

It is important to focus on the long-term goal, not on one specific data point or indicator. Long-term fundamentals are what matter. In markets and moments like these, it is essential to stick to the financial plan. Investing is about following a disciplined process over time.

Sources: Fidelity, JP Morgan

The Markets Rallied in April — Despite So Much Pressure and Uncertainty

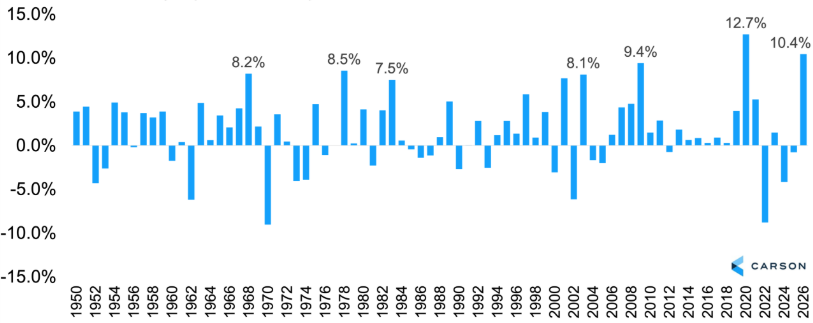
April 2026 was one for the record books. Markets pushed through considerable geopolitical turbulence to reach new highs. Even with the Strait of Hormuz still severely restricted and oil back above $100 a barrel, the S&P 500 posted its best month since November 2020 — rising 10.4% and delivering its second-best April since 1950. The NASDAQ surged more than 15%, marking its strongest month since April 2020.

The Second-Best April Ever

S&P 500 returns in April (1950-present)

Source: Carson Investment Research, Factset 4/30/2026.

Global stocks rotated back into artificial intelligence stocks. AI continues to have a major impact on the economy, and AI-related investment continues to rise. We expect the AI wave to keep supporting the stock market, even as inflation remains high.

The Federal Reserve continues to keep interest rates at current levels despite a new wave of inflationary pressures moving through the economy. Inflation accelerated in March, with CPI rising at a 3.3% annual rate — its hottest level in almost two years. The increase has been driven largely by higher energy costs tied to the war in Iran.

Food and energy prices tend to be volatile month to month, and the Fed cares more about the broader inflation trajectory. The current wave of inflation is being driven less by a hot economy and more by specific energy constraints. Raising rates will not increase the amount of oil in the global economic system.

Current parallels exist between today’s inflation resurgence and the 2021–2022 surge that saw CPI rise above 9%. The 2022 spike also occurred against the backdrop of a geopolitical conflict and higher energy prices. Supply-chain disruptions are once again playing a role, as they did then. Fiscal stimulus pressures are also coinciding with rising prices, this time flowing from the One Big Beautiful Bill tax cuts.


Promo for an article titled From Oil Spikes to Market Recovery: Here's What History Shows.

There are also several differences this time around. In 2022, the job market was tight, wage growth was surging, and inflationary pressures were much broader. Today, the labor market is more stable and cooler than it was four years ago. Wage growth has slowed, making it harder for companies to raise prices. The immediate impact of fiscal stimulus is also more modest than during the pandemic, with most inflationary pressures tied to energy, as mentioned earlier.

The renewed inflation pressures have not been strong enough to put rate hikes back on the table anytime soon, but they have been strong enough to delay interest rate cuts for now. The interest-rate futures market is showing no rate cuts for 2026. At the beginning of the year, markets were expecting one to two interest rate cuts in 2026. Those expectations could always shift in either direction as new data comes in and the Fed’s upcoming leadership change plays out.

April was a month that defied the headlines. Geopolitical pressures pushed oil above $100 a barrel, yet optimism around a potential resolution to the conflict, combined with a strong corporate earnings backdrop, propelled markets to new highs led by AI-related stocks.

The risks remain two-sided: A reopening of the Strait of Hormuz could see energy prices fall and rate expectations ease, while a continued blockade could dampen activity and lead to further inflationary pressures. A well-diversified portfolio across asset classes and geographies remains as important as ever.


Promo for an article titled Here's Why the Stock Market is the Best Place to Build Wealth.

The CD Wealth Formula

We help our clients reach and maintain financial stability by following a specific plan, catered to each client.

Our focus remains on long-term investing with a strategic allocation while maintaining a tactical approach. Our decisions to make changes are calculated and well thought out, looking at where we see the economy heading. We are anticipating and moving to those areas of strength in the economy and in the stock market. 

We will continue to focus on the fact that what really matters right now is time in the market, not out of the market. That means staying the course and continuing to invest, even when the markets dip, to take advantage of potential market upturns. We continue to adhere to the proven disciplines of diversification, periodic rebalancing, and forward-looking strategies, while avoiding reliance on stale retrospective data.

It is important to focus on the long-term goal, not on one specific data point or indicator. Long-term fundamentals are what matter. In markets and moments like these, it is essential to stick to the financial plan. Investing is about following a disciplined process over time.

Sources: Carson, Fidelity, JP Morgan

From Oil Spikes to Market Recovery: Here’s What History Shows

The last few weeks have reminded us how quickly markets can shift. We also are reminded that this isn’t new. History shows the market has always recovered from previous declines.

Just three weeks ago, the S&P 500 was close to correction territory, the NASDAQ and Russell 2000 indexes were both down more than 10%, and oil prices were over $120 per barrel. While oil prices have come down, they remain higher than pre‑conflict levels.

Historically, sharp increases in oil prices have often preceded recessions and, in some cases, contributed to bear markets. Think back to early 2022, when Russia invaded Ukraine: Oil prices surged to almost $130 per barrel as the Fed began raising rates aggressively.

Stocks dropped almost 20% that year but then rallied hard in 2023, as energy markets stabilized and corporate earnings proved more resilient than investors expected.

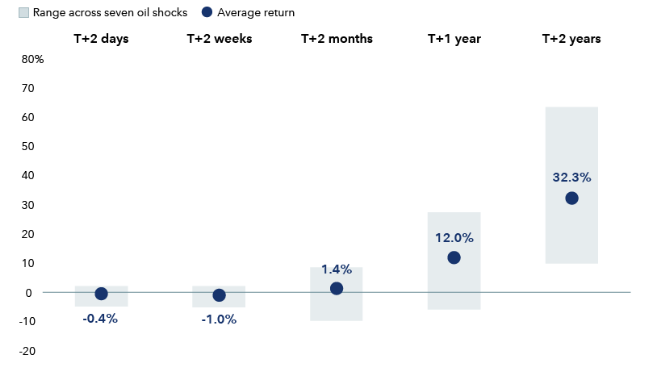
While the Iran conflict so far has not proven to be as severe as a typical market drawdown, it is a reminder that markets tend to absorb shocks faster than headlines would lead us to believe. Since 1990, markets have averaged gains of roughly 12% in the first year after an oil supply shock — and more than 32% over the following two years later.


Market selloffs from oil shocks have been short-lived

S&P 500 Index returns following geopolitical-related oil supply disruptions, 1990-2024

Graphic showing S&P 500 Index returns following geopolitical-related oil supply disruptions.
Sources: Capital Group, Bloomberg, Standard & Poor’s. Specific geopolitical events that are reflected in average returns figures include: First Gulf War (August 1990), Second Gulf War (March 2003), Niger Delta supply disruptions (February 2006), Arab Spring and Libyan civil war (February 2011), Hormuz closure risk and Iran sanctions (December 2011), drone attack on Saudi oil stations (September 2019), Russian invasion of Ukraine (February 2022). Event dates are aligned to the nearest observable market price (“T”). If a shock occurs on a nontrading day, the prior trading day is used as the start date. Horizon returns are measured using the first available trading day on or after the stated calendar horizon (e.g., “T+2 days”). Figures reflect totals as of March 10, 2026.

We know how easy it is for investors’ emotions to take over when markets get rough. Dollar-cost averaging is one way to take the emotions out of your investing decisions. With this strategy, you invest money in equal amounts at regular intervals, regardless of which direction the market is going.

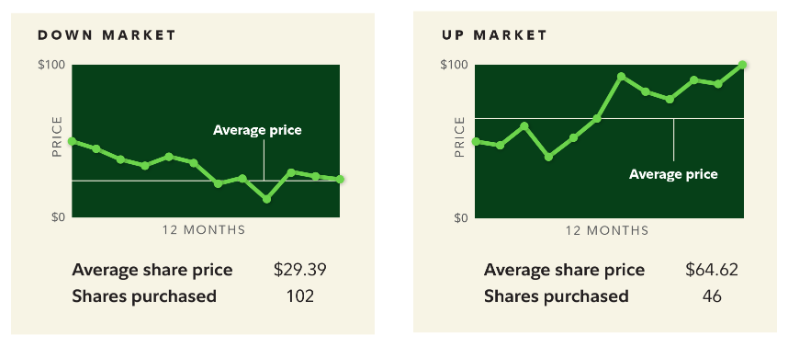
By continuing to invest regularly during a volatile or down market, you are more likely to purchase a greater number of shares at lower prices compared to investing during an up market.

Let’s say you invest $250 per month into a stock, index fund or mutual fund. If the stock price is rising, you may be buying a few shares each month, whereas in a down market, you are buying more shares for the same amount of money. On average, investors pay less on per share over time.

Regular investing doesn’t ensure a profit or protect against loss, but if you can buy more shares for the same amount of money for a solid long-term investment, it makes more sense than trying to time the purchase.


Dollar-cost averaging in different markets

Here’s what happens if you invest $250 a month for a year in up and down markets

Graphic showing what happens if you invest $250 a month for a year in up and down markets.
This example is for illustrative purposes only and does not represent the performance of any security. Consider your current and anticipated investment horizon when making an investment decision. Dollar-cost averaging does not assure a profit or protect against loss in declining markets. For the strategy to be effective, you must continue to purchase shares in both market ups and downs.

Emotional reactions to market events are perfectly normal. It is understandable to feel nervous when markets decline, but the actions taken during such periods can determine a successful long-term outcome.

Understanding emotional behaviors such as loss aversion, anchoring, confirmation bias, and availability bias can help you avoid potential mistakes, such as selling at a market bottom.

• Loss aversion is a behavioral bias where investors feel the pain of losses more strongly than the pleasure of equivalent gains. This can show in different ways: refusing to sell something for a loss, selling winners too early, or becoming more conservative after a loss. This also can lead to being riskaverse at the wrong time.

• Anchoring is a bias where one fixates on initial piece of information, such as the purchase price of stock, a target price, or valuation multiple. Once anchored, investors subconsciously compare all future information to that reference point.

• Confirmation bias happens when an investor looks for information to support their belief, while ignoring new information that may contradict that belief. This shows up in overconcentration in favored ideas and the dismissal of contradictory signals.

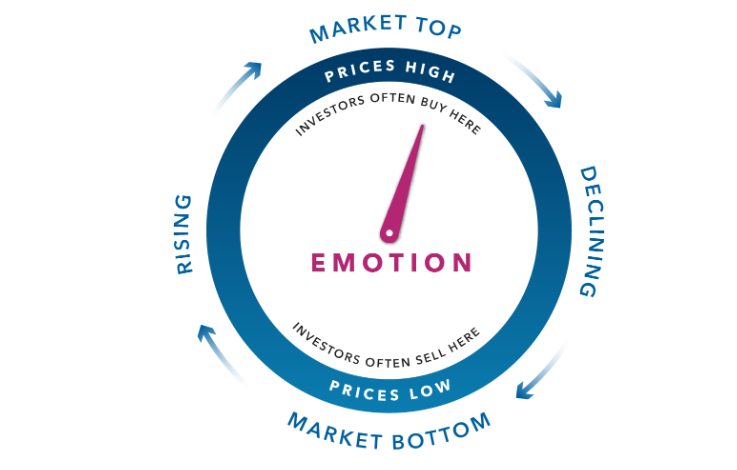
• Availability bias is a behavioral bias in which investors favor information that is more recent or memorable and give less consideration to information that is less memorable. In simple terms, what comes to mind easily feels more important than it really is. Most often, this results in buying high and selling low, as shown in the illustration below.


Illustration of sales cycles and emotions.

Market volatility can be unsettling, but it is not a reason to panic. It can present an opportunity to boost savings and buy more of your investments at lower prices.

If you have a solid plan in place, sticking with that plan — buying more when investments are on sale — can help position you for better outcomes as the uncertain times pass and markets move toward greener pastures.

Understanding behavioral tendencies and how they affect your view of the markets goes a long way to long-term financial success.


Promo for an article titled What's Happening With Private Credit and How Could It Affect Investors?

The CD Wealth Formula

We help our clients reach and maintain financial stability by following a specific plan, catered to each client.

Our focus remains on long-term investing with a strategic allocation while maintaining a tactical approach. Our decisions to make changes are calculated and well thought out, looking at where we see the economy heading. We are anticipating and moving to those areas of strength in the economy and in the stock market. 

We will continue to focus on the fact that what really matters right now is time in the market, not out of the market. That means staying the course and continuing to invest, even when the markets dip, to take advantage of potential market upturns. We continue to adhere to the proven disciplines of diversification, periodic rebalancing, and forward-looking strategies, while avoiding reliance on stale retrospective data.

It is important to focus on the long-term goal, not on one specific data point or indicator. Long-term fundamentals are what matter. In markets and moments like these, it is essential to stick to the financial plan. Investing is about following a disciplined process over time.

Sources: Fidelity, Capital Group

Volatility Has Returned to the Market — Here’s How to Think About It

After setting new all-time highs in January, the S&P 500 has been down for five straight weeks and is nearing a 10% correction. The NASDAQ, Dow, and Russell 2000 already have crossed into correction territory, all down more than 10% from their highs.

While this feels significant, it’s important to remember that pullbacks like this are a normal part of investing and historically have occurred in most years.

Still, the drumbeat is hard to ignore:

• Stocks are having their worst month and worst quarter since 2022, and the Dow is set to end its 10-month winning streak.
• The VIX index, which measures short-term market volatility, is up more than 50% for the month.
• The price of gas in the U.S. is at $4 per gallon, and Brent Crude is up more than 55% for the month.
• Gold and silver prices have tumbled.

Market downturns can be unnerving. Investor sentiment feels much worse, and that is a good thing for the market. It doesn’t mean that we are at a bottom, but greater fear means that more bad news may be priced into the market.

Many find it difficult to stay the course as stocks are declining, but as we have already seen during this downturn, opportunities exist for investors.


Past performance is no guarantee of future results. Biggest drop refers to the largest drop from a peak to a trough in the S&P 500 during each calendar year. Data as of Dec. 31, 2025. Sources: Standard & Poor’s, Bloomberg Finance LP, Fidelity Investments.

Corrections are a normal part of investing. Since 1980, the S&P has experienced a drop of 5% or more in 93% of calendar years and has experienced a decline of 10% or more in almost half of the years. Going back to 1928, pullbacks of 10% or more happen every 13 months on average, or almost once a year over the last 100 years.

Despite the frequent declines in the market, the return for an average calendar year over the same period is a positive 13.3%. Historically, markets recover quickly from corrections.

The chart below reviews the largest drop from a market high in each year. Looking at the red dots, you can see it is common to experience significant market declines in any given year, yet the market still has often recovered and produced positive results. Since 1980, declines of at least double digits happened at some point in 24 years — and in 14 of those years, stocks went on to finish higher.


Past performance is no guarantee of future results. Returns are based on index price appreciation and dividends. Indexes are unmanaged. It is not possible to invest directly in an index. Biggest drop refers to the largest index drop from a peak to a trough during each calendar year. Biggest rally refers to the largest index gain from a trough to a peak during each calendar year. Data as of Dec. 31, 2025. Sources: Standard & Poor’s, Bloomberg Finance LP, Fidelity Investments.

In such times of uncertainty, it is easy for investors to feel that this time is different and fear the worst. Markets can react to headlines and emotions in the short term, but over the longer term, stocks revert to fundamentals. If corporate profits are rising, stocks are going to rise, regardless of the noise.

In today’s economy, earnings continue to rise. AI demand has shown no signs of slowing. Airlines reported solid guidance, even with higher oil prices. The S&P 500’s forward 12-month earnings estimates hit another new high last week, as did profit margins. Earnings and profit margins are strong indicators for the stock market.


Psychologically, the raw emotions of the present are more powerful than the distant emotions of an uncertain future. In periods like this, the urge to act is strong. Doing something can feel like regaining control, but it often works against long-term outcomes.

Think of it like being on a ship in rough water. Focus on the waves, and you feel worse. Focus on the horizon, and you steady yourself. Investing works the same way.

“What if” fears about the stock market based on current news, such as questions about the war in Iran, can cause seasickness. Don’t just think about the next six months; look out beyond. As the horizon expands, volatility shrinks.

Remember, we are more motivated to avoid loss than to pursue gains. There is a tradeoff in every decision that is made. With a longer-term plan in place, focus on the details of the plan and your dreams.

When things are more volatile and uncertain, it feels like we have lost control. The need for control is very powerful, so we often take action to feel like we are in control. This is a natural reaction.

Unfortunately, taking action simply for the purpose of taking action can have unintended consequences — and financially, making rash decisions seeking control today can undermine the long-term strategy and lead to giving up control of your future.


Promo for an article titled What's Happening With Private Credit and How Could It Affect Investors?

The CD Wealth Formula

We help our clients reach and maintain financial stability by following a specific plan, catered to each client.

Our focus remains on long-term investing with a strategic allocation while maintaining a tactical approach. Our decisions to make changes are calculated and well thought out, looking at where we see the economy heading. We are anticipating and moving to those areas of strength in the economy and in the stock market. 

We will continue to focus on the fact that what really matters right now is time in the market, not out of the market. That means staying the course and continuing to invest, even when the markets dip, to take advantage of potential market upturns. We continue to adhere to the proven disciplines of diversification, periodic rebalancing, and forward-looking strategies, while avoiding reliance on stale retrospective data.

It is important to focus on the long-term goal, not on one specific data point or indicator. Long-term fundamentals are what matter. In markets and moments like these, it is essential to stick to the financial plan. Investing is about following a disciplined process over time.

Sources: Carson, Fidelity, JP Morgan

What’s Happening With Private Credit — and How Could It Affect Investors?

Lately, it feels like every time you tune into a business network, they are talking about the possibility of a private credit crisis. Private credit refers to loans made by non-bank lenders, such as private equity firms like Blackstone, KKR, and Apollo, to name a few. Private credit offers borrowers faster, more customized access to financing than traditional bank lending.

Historically, institutional investors have invested in private credit in search of higher yields — often double digits — and lower correlation to publicly traded stock and bond markets. Over time, private credit has expanded into more portfolios through funds designed for individual investors.

Many private loans do not trade frequently, which can make them less liquid and more difficult to sell quickly when markets turn volatile. Most loan terms are three to seven years, while investors are typically able to ask for redemptions quarterly.


Illustration showing the differences between publicly syndicated loans and private credit.
Source: Blackstone

Private credit has moved from a niche corner of the financial system to an established component of the below-investment-grade credit markets. What began in the mid-2000s as a relatively small and specialized form of nonbank lending has grown into a significant source of financing for small and medium‑sized companies, operating alongside the leveraged loan and high‑yield bond markets.

There are many different types of private credit loans, with the most common being direct lending, mezzanine or second-lien debt, distressed debt, special situations and asset-based finance.


Chart showing how much money is in public credit and private credit.
Sources: Apollo, State Street Investment Management, SIFMA, as of 7/24/25.

How private credit works

The borrower, which could be a private or public company, negotiates privately with a non-bank lender on the terms of the loan. Private credit often contains a floating rate and is structured with customized terms unique to the borrower and the lender.

Historically, most investors viewed these loans as below investment grade. As private credit has evolved, the types of companies accessing it have expanded as well; borrowers ranging from blue-chip companies to small and mid-size companies may seek funding through private credit markets to support their capital needs.

Why would borrowers turn to private credit?

• Flexibility for borrowers: Private credit allows borrowers and lenders to structure more flexible deals than traditional lending. Borrowers also can get loans and financing faster.
• Bank regulatory changes: Increased regulations and capital requirements make it harder for banks to extend loans.
• Ability to avoid equity financing: Borrowers can access money without diluting ownership.


Promo for an article titled Transparency over Illusion — the case for liquid investments.

Putting it in context

Private credit’s growth has been substantial. Over roughly 20 years, private credit assets have increased nearly 20‑fold, reflecting both sustained investor demand for higher-yielding credit assets and changes in bank regulation. Today, private credit features prominently in corporate capital structures and institutional portfolios — as well as an increase in banks’ own lending exposures through financing provided to private credit managers.

Recent events have brought attention to how risk is evolving as the market matures. Private credit is subject to the same underlying economic forces that affect other risky markets, illustrated by restructurings and write‑downs at borrowers such as Tricolor and First Brands, warnings about market stresses in late 2025, and more recent pressure linked to revised assumptions in certain software‑as‑a‑service (SaaS) business models.

The private credit market, now estimated at approximately $2 trillion to $3 trillion, is experiencing a period of significant stress characterized by high-profile redemption requests and mounting concerns over loan quality. While the asset class grew rapidly after the 2008 financial crisis as banks retreated from certain lending, it is now facing its first full test in an environment of higher interest rates.

One recent area of stress in the private credit market involved a business development company (BDC) called Blue Owl. (BDCs are investment vehicles designed to provide capital to small and mid-sized businesses, often by making private loans.) In Blue Owl’s case, investor withdrawals were limited due to an overwhelming request from investors seeking to access their capital.


Promo for an article titled Here's Why the Stock Market is the Best Place to Build Wealth.

Why is the market seeing high redemptions?

1. Redemption squeeze: Major funds are seeing record levels of investors trying to pull their money out, leading to withdrawal caps.

BlackRock Inc. capped withdrawals from its HPS Corporate Lending Fund at 5% after requests nearly doubled that amount.
• Blackstone Inc. allowed record redemptions of 7.9% from its flagship BCRED fund.
• Cliffwater LLC and Blue Owl Capital have also recently faced significant redemption pressure.
• JPMorgan Chase & Co. has reportedly restricted some lending to private credit funds after marking down the value of certain loans in their portfolios.

2. Rising default rates and asset quality: Signs of borrower distress are becoming more visible across the industry.

Default rates: The U.S. private credit default rate rose to 5.8% in January, up from 5.6% in December.
• Shadow defaults: The rate of companies requiring unexpected changes to loan terms (often signaling distress) jumped from 2.5% to 6.4% over the past year.
• PIK loans: There is an increasing use of payment-in-kind (PIK) interest, where borrowers defer cash interest by adding it to their principal debt. PIK income reached roughly 8.8% of total investment income in late 2025.
• Free cash flow: Around 40% of private credit borrowers now have negative free cash flow, significantly higher than the 25% seen in 2021. 

3. Sector-specific and structural risks

AI disruption: Concerns are mounting over loans to software firms, whose business models face disruption from rapid advancements in artificial intelligence.
• Opacity and valuations: Skeptics, including JPMorgan CEO Jamie Dimon, have warned of “cockroaches” (hidden problems) due to the market’s lack of transparency and potentially stale asset valuations.
• Concentration: Many direct lending portfolios are heavily weighted toward the software industry, which may constrain future performance.

4. Shifting market opportunities: Despite the current squeeze, some market segments are seeing growth or strategic shifts.

Asset-based finance (ABF): Investors are increasingly looking at ABF — lending against physical collateral like aircraft or equipment — as a more resilient alternative to corporate direct lending.
• Retail expansion: A 2025 executive order paved the way for retail investors to allocate retirement funds like 401(k)s into private credit, potentially bringing a massive new wave of capital to the sector.
• Opportunistic funds: New “war chests” of approximately $100 billion have been raised by distressed and opportunistic credit funds to snap up assets if the market continues to slide.

5Liquidity mismatch: Investors are pulling funds from private credit lenders, but private loans are illiquid. Funds offering quarterly liquidity may limit withdrawals to keep from having to sell off loans at low values to meet redemption requests.

6. Valuation and transparency risk: Unlike publicly traded stocks and bonds, private loans do not trade on exchanges. Their value is determined by the fund manager or third-party valuation firms. This can lead to pricing that doesn’t reflect real-time market declines. In a crisis, the lack of a clear market price can make it difficult for an investor to know the true worth of their holding.


Promo for a white paper to download and share titled The Case for Liquid Investments.

Comparisons to 2008

Some observers have started drawing parallels between the private credit market today and the conditions that preceded the 2008 financial crisis, including the lack of transparency within private credit funds and asset managers halting withdrawals. Additionally, private credit lenders have made substantial loans to the tech sector —particularly software companies — though we don’t know the full extent because of a lack of transparency.

Falling asset prices can be an early warning signal, but markets aren’t always rational. The private credit market makes up less than half of the mortgage universe in 2008, which is a positive. Default rates remain low, though they are rising.

Investing in private credit involves risk, and those risks have intensified as the market has grown. While private credit may offer higher yields due to illiquidity premiums, the lack of transparency and liquidity outweigh the potential income, in our opinion.

At CD Wealth, being able to access funds when needed remains the utmost priority. At this moment, many investors in private credit cannot access their funds and the true value of the portfolio remains unknown. We will continue to closely monitor private credit and its potential impact on the rest of the market.

The CD Wealth Formula

We help our clients reach and maintain financial stability by following a specific plan, catered to each client.

Our focus remains on long-term investing with a strategic allocation while maintaining a tactical approach. Our decisions to make changes are calculated and well thought out, looking at where we see the economy heading. We are anticipating and moving to those areas of strength in the economy and in the stock market. 

We will continue to focus on the fact that what really matters right now is time in the market, not out of the market. That means staying the course and continuing to invest, even when the markets dip, to take advantage of potential market upturns. We continue to adhere to the proven disciplines of diversification, periodic rebalancing, and forward-looking strategies, while avoiding reliance on stale retrospective data.

It is important to focus on the long-term goal, not on one specific data point or indicator. Long-term fundamentals are what matter. In markets and moments like these, it is essential to stick to the financial plan. Investing is about following a disciplined process over time.

Sources: State Street, US Bank, Bloomberg, Barrons, CNBC