Here are the most frequently searched questions that have led readers to our Insights page so far this year — and the answers they found. If you find our articles helpful, please feel free to share them with your family and friends!
1. Are we in a bull market?
(Also searched often: When will the bull market end?)
Yes, we are still in a bull market. The current rally began in October 2022.
You can’t pinpoint the exact end of a bull market, but there are common signals that investors and analysts watch for. A bull market often ends when economic conditions shift: slowing growth, rising unemployment or tighter monetary policy from the Federal Reserve. Market indicators like falling corporate earnings, an inverted yield curve or a broad decline across major stock indexes can also suggest the rally is losing steam.
The end of a bull market is usually only clear in hindsight, but watching economic fundamentals and earnings trends can provide early warning signs.
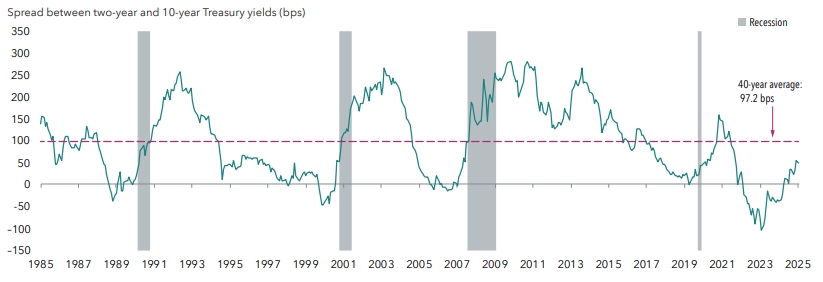
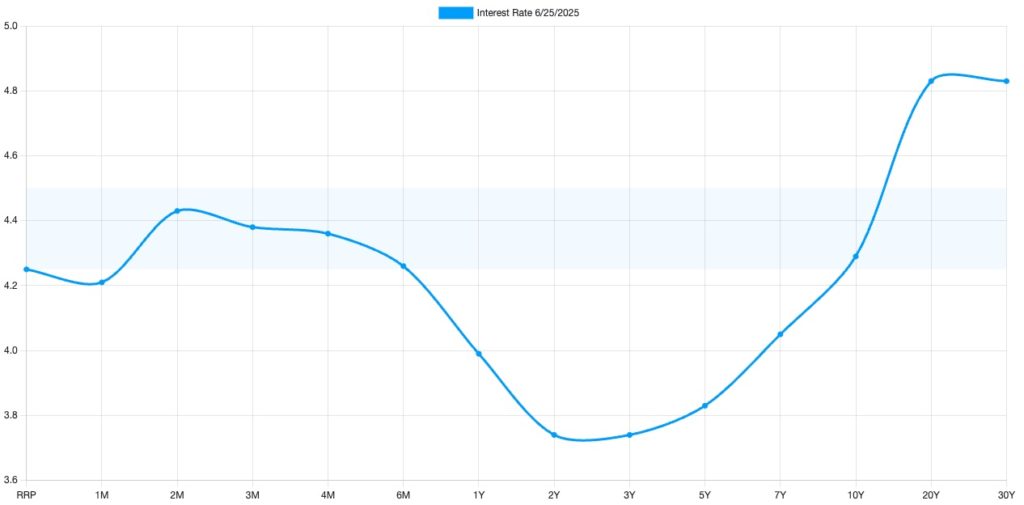
2. Why is the 10-year Treasury important?
The 10-year U.S. Treasury yield is a critical economic indicator because it influences borrowing costs, reflects investor sentiment and serves as a benchmark for various interest rates. As the yield on the 10-year Treasury rises, so do mortgage rates and other borrowing rates, affecting consumer spending and business investments.
When the yield declines, borrowing becomes cheaper, potentially stimulating economic activity. A rising yield might prompt the Fed to raise short-term rates, while a falling yield could lead to lower rates to support economic growth. Monitoring the 10-year Treasury yield provides valuable insights into economic expectations and can guide investment and policy decisions.
3. Is compound interest taxed?
Compound interest itself isn’t directly taxed, but the earnings it generates — such as interest or dividends — are typically taxable in the year they’re received, even if you reinvest them, reducing the effective return in taxable accounts.
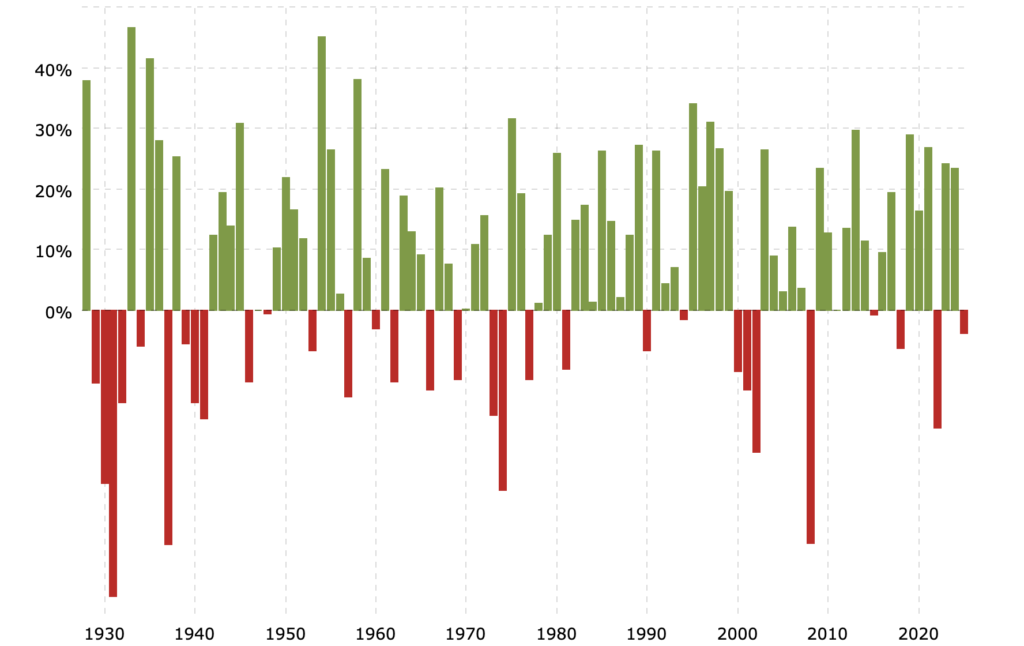
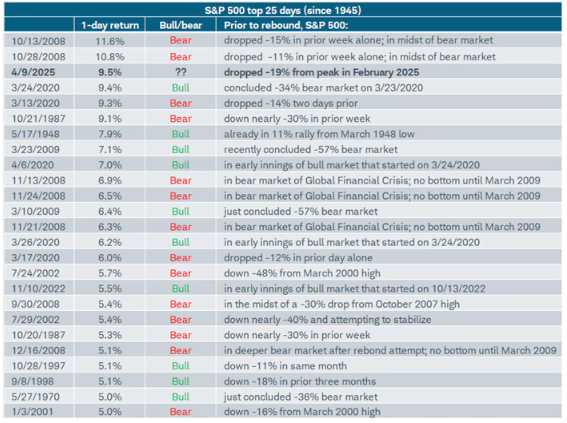
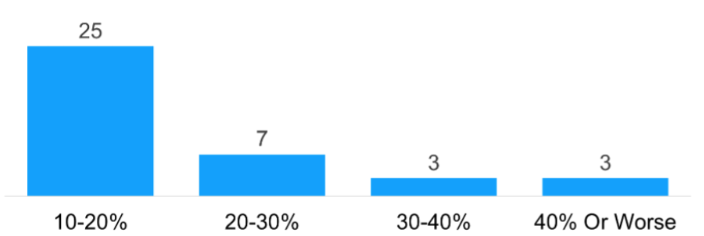
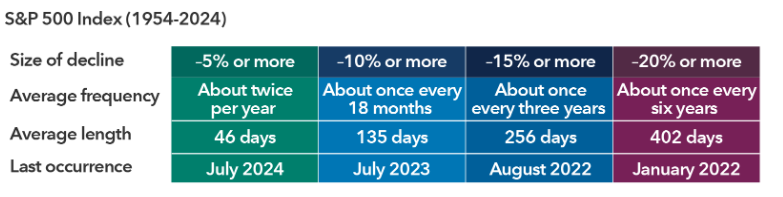
4. How often do stock market corrections happen?
Since World War II, there have been 48 market corrections, but only 12 of those escalated into full-fledged bear markets. While a correction (typically defined as a 10%+ drop) is fairly common, most don’t become much more serious. Since 1980, the S&P 500 has fallen 5% or more in nearly every year (93% of the time) and dropped 10% or more in almost half of the years (47% of the time), showing that double-digit pullbacks happen more than half the time and aren’t unusual.

5. How can I avoid a wash sale?
You need to wait at least 30 days before or after selling an investment at a loss before buying it back (or buying anything too similar) so that the IRS doesn’t disallow your tax deduction. A good way to stay safe is to use the money to buy something different, like another stock or a different type of fund, instead of the same or nearly identical investment. Be careful if you trade in retirement accounts or across different accounts you own, because those count too. If you’re unsure what “too similar” means, it’s best to ask a tax professional.
6. How can I talk to my aging parents about their future?
Start any conversation with your aging parents in a calm and non-judgmental way and remember it doesn’t all have to happen at once. Gently focus on their hopes and needs, such as their health, housing, long-term care, legal documents and estate plans. Holidays or relaxed family times are great opportunities to begin; break the discussion into smaller chats over several days rather than doing it all at once.
Ask practical questions, like where they keep important records, whether they’ve updated wills, powers of attorney, healthcare directives, or long-term care plans — and make sure you know their doctors. Ask about their insurance policies and see if they will share access to any safety deposit boxes. Also, help shield them from financial scams by staying connected, teaching them about digital red flags and encouraging judgment-free communication so they feel supported and in control, not rushed or defensive.
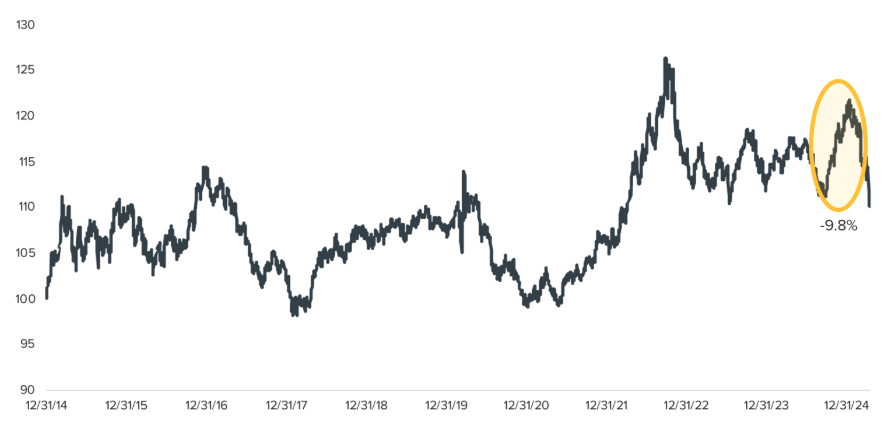
7. What does a strong dollar mean?
A stronger U.S. dollar often is the result of higher interest rates that attract global investment into U.S. bonds or perceptions of the U.S. as a safer financial haven. It means more purchasing power abroad, letting Americans pay less when traveling or buying imports. However, it can hurt U.S. companies with large international operations by shrinking the value of overseas earnings when converted back to dollars and making their goods more expensive to foreign buyers.
8. What investments are liquid?
Liquid investments are those you can quickly buy or sell — like stocks, bonds, ETFs, mutual funds, money market funds and short-term instruments such as Treasury bills or CDs — without significantly affecting their price, making them great for accessing cash when needed. These assets benefit from regulatory oversight, transparent pricing and real-time valuations, which help reduce uncertainty and ensure accountability.
By contrast, illiquid investments like private deals or partnerships may promise higher returns but often come with long lock-up periods, less transparency and potential conflicts of interest. Keeping your portfolio in liquid markets helps preserve flexibility, clarity and control — even if those investments may not be as flashy as alternatives.

The CD Wealth Formula
We help our clients reach and maintain financial stability by following a specific plan, catered to each client.
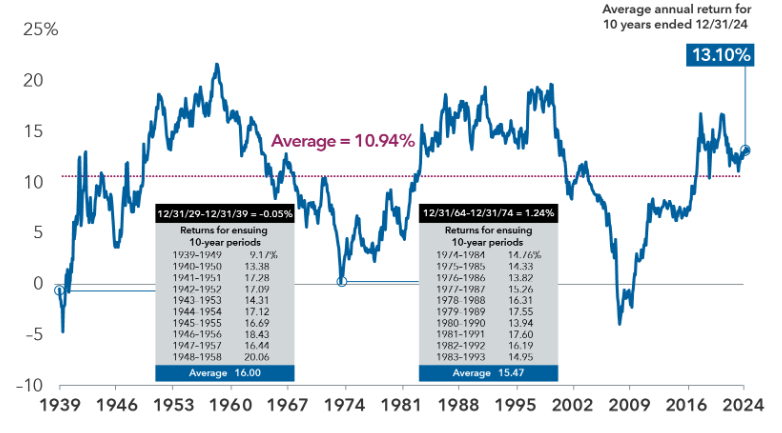
Our focus remains on long-term investing with a strategic allocation while maintaining a tactical approach. Our decisions to make changes are calculated and well thought out, looking at where we see the economy is heading. We are not guessing or market timing. We are anticipating and moving to those areas of strength in the economy — and in the stock market.
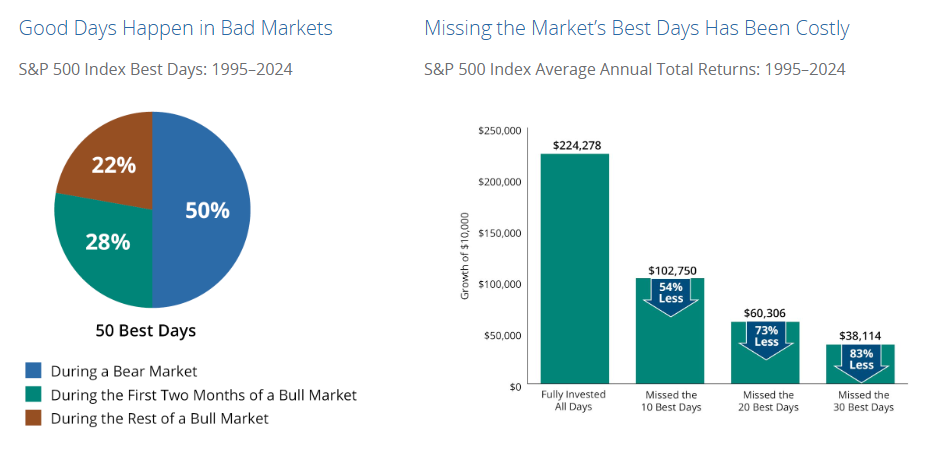
We will continue to focus on the fact that what really matters right now is time in the market, not out of the market. That means staying the course and continuing to invest, even when the markets dip, to take advantage of potential market upturns. We continue to adhere to the tried-and-true disciplines of diversification, periodic rebalancing and looking forward, while not making investment decisions based on where we have been.
It is important to focus on the long-term goal, not on one specific data point or indicator. Long-term fundamentals are what matter. In markets and moments like these, it is essential to stick to the financial plan. Investing is about following a disciplined process over time.