After nine consecutive weeks of gains, the S&P 500 finally fell last week, marking the end of the longest win streak since 2004. The end-of-the-year rally was strong, thanks to the Federal Reserve’s pivot that signaled interest rate cuts may be ahead.
After a late comeback from bonds, last year was the third-best year out of the last 20 for a global 60/40 stock/bond portfolio. Investors have already started to worry that the Santa Claus rally fizzled out, and the first five days of the year ended down.
The markets have seen extreme strength since late October (and remember, the markets do not go up in a straight line). Some now worry that the gains of last year are in the rearview mirror because of mixed economic data, speculation about rate cuts and war in the Middle East.
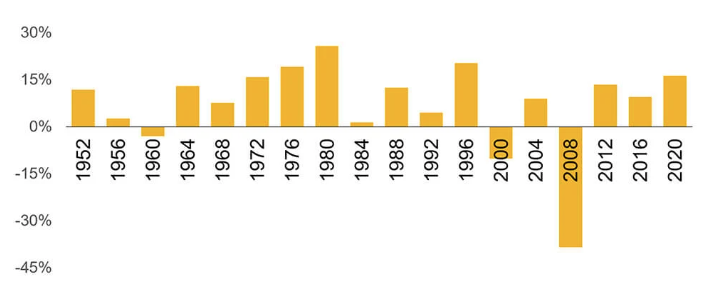
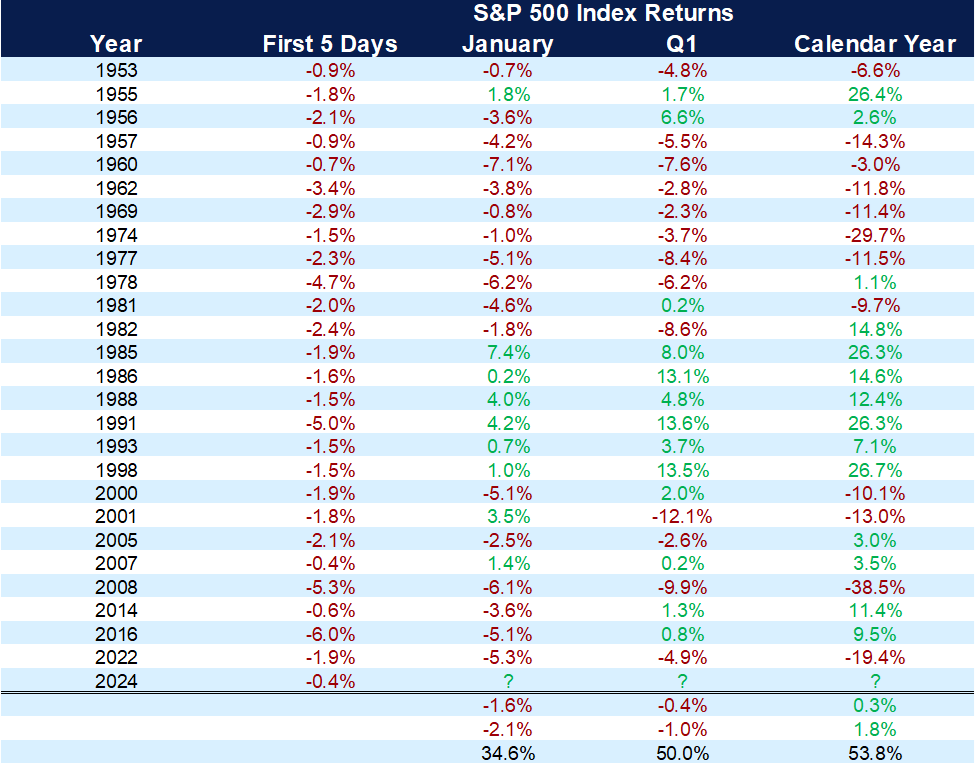
The chart below shows that the first five trading days of the year have been negative 27 times over the last 70, years and the results have been mixed. In 12 of the 27 instances, negative returns for the S&P 500 have followed for an average downturn of 15%. However, the market finished up 14 times with an average return of 13.25%. We are not ready to determine how the year is going to finish based on five trading days.
A Negative First 5 Days Could Be a Warning Sign
S&P 500 performance when the first five days are negative
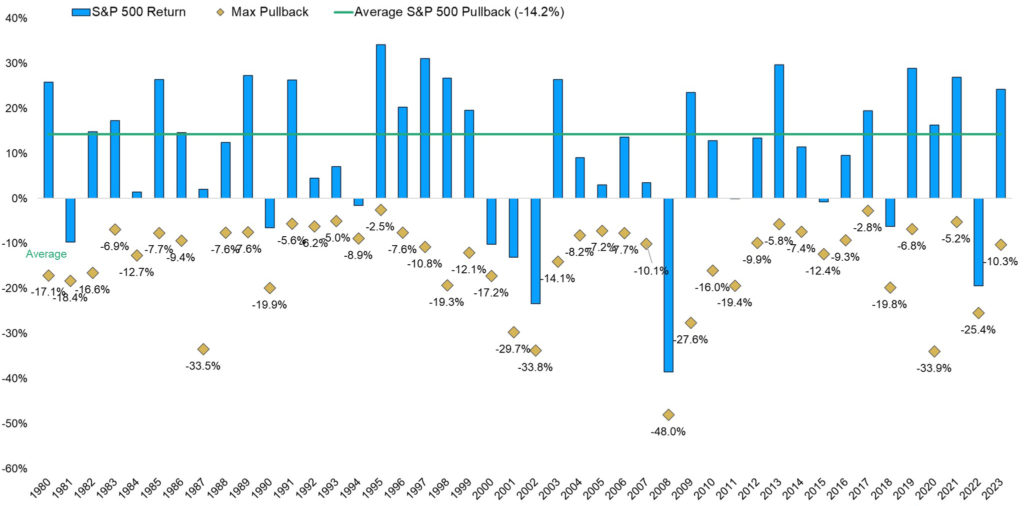
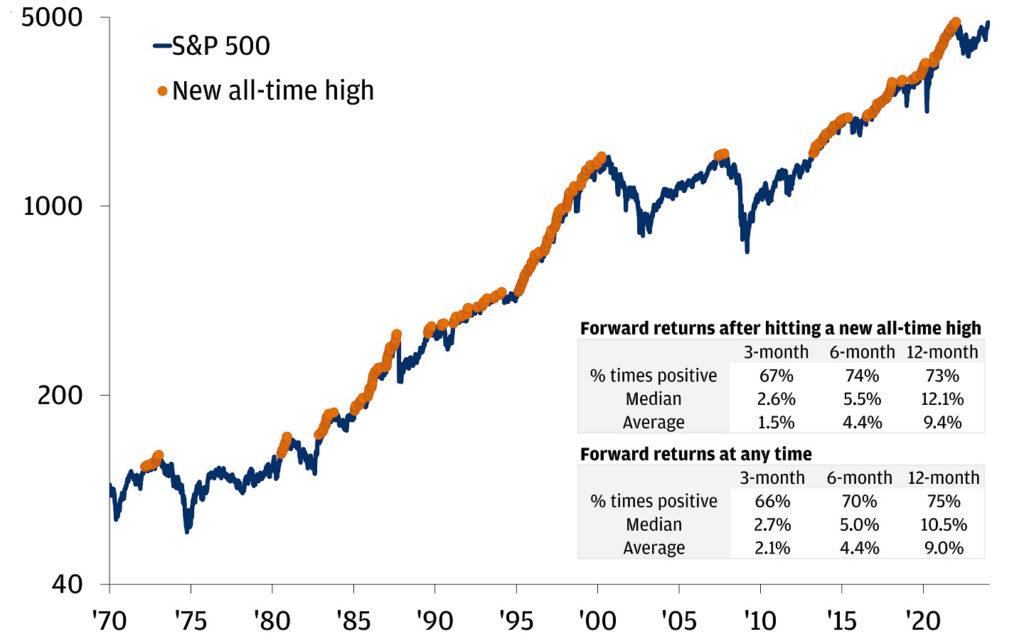
The S&P 500 remains in close range to all-time trading highs. As of this writing, the S&P is a little more than 1% below its record high, set in January 2022. Some may worry that they have missed the rally or question if it makes sense to invest at these levels. Investing at all-time highs has not historically led to a meaningful difference in future returns.
Over the last 50+ years, if you invested in the S&P at all-time highs, your investment would have been higher 70% of the time one year later, with a median return of 12%. If you had invested at any time, the median return a year later would have been 10.5%.
You know the drill: We talk regularly about not timing the market, and we don’t see these circumstances any differently. We recognize that markets are near all-time highs, but that does not mean the market is not investible or that investors should wait for a potential pullback.
Stocks Have Historically Never Failed to Regain a Prior High
S&P 500 Index level and all-time highs, 1970-present
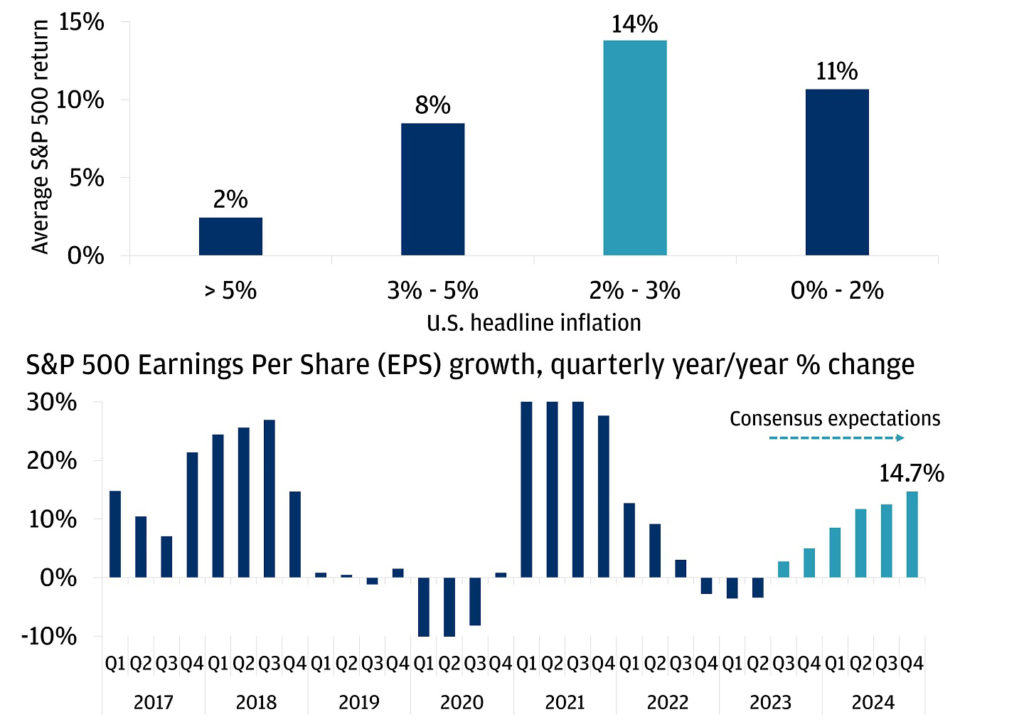
Historically, times like these — marked by slowing inflation, solid earnings growth and the Fed easing — tend to be a good time for stocks. Analysts expect double-digit earnings growth for 2024. At the same time, when inflation has been between 2% and 3%, stocks have returned an annual average rate of 14% going back to 1950. Another interesting tidbit is that in years when the Fed has cut rates without a recession, we have seen the strongest market returns.
Stocks Are in the Sweet Spot: Moderate Inflation & Accelerating Earnings
S&P 500 annual returns in different inflation environments, 1950-2022
The recession that many have been fearing since the start of 2023 has yet to materialize, and those who have been predicting a full recession have moved to a potential “soft landing.” The U.S. economy is strong, with GDP at 4.9%, unemployment under 4% and Consumer Price Index last reported at 3.1%. At year end, there was almost $6 trillion of cash sitting in money market funds.
A healthy economy may mean that the Fed does not cut rates as much as markets expect. Current economic numbers suggest that there will be no recession in 2024. While economic conditions appear solid, the bottom line is that there are sure to be surprises in the year ahead, as there have always been. This is an important time to remember that time in the market beats timing the market and waiting for bad news to bring the market down.
The CD Wealth Formula
We help our clients reach and maintain financial stability by following a specific plan, catered to each client.
Our focus remains on long-term investing with a strategic allocation while maintaining a tactical approach. Our decisions to make changes are calculated and well thought out, looking at where we see the economy is heading. We are not guessing or market timing. We are anticipating and moving to those areas of strength in the economy — and in the stock market.
We will continue to focus on the fact that what really matters right now is time in the market, not out of the market. That means staying the course and continuing to invest, even when the markets dip, to take advantage of potential market upturns. We continue to adhere to the tried-and-true disciplines of diversification, periodic rebalancing and looking forward, while not making investment decisions based on where we have been.
It is important to focus on the long-term goal, not on one specific data point or indicator. Long-term fundamentals are what matter. In markets and moments like these, it is essential to stick to the financial plan. Investing is about following a disciplined process over time.
Sources: Carson, JP Morgan

This material contains an assessment of the market and economic environment at a specific point in time and is not intended to be a forecast of future events, or a guarantee of future results. Forward-looking statements are subject to certain risks and uncertainties. Actual results, performance, or achievements may differ materially from those expressed or implied. Information is based on data gathered from what we believe are reliable sources.
Using diversification as part of your investment strategy neither assures nor guarantees better performance and cannot protect against loss of principal due to changing market conditions.
Past performance is not a guarantee of future results.
The opinions expressed in this commentary are those of the author and may not necessarily reflect those held by Kestra Investment Services, LLC or Kestra Advisory Services, LLC. This is for general information only and is not intended to provide specific investment advice or recommendations for any individual. It is suggested that you consult your financial professional, attorney, or tax advisor with regard to your individual situation.
Securities offered through Kestra Investment Services, LLC (Kestra IS), member FINRA/SIPC. Investment Advisory Services offered through Kestra Advisory Services, LLC (Kestra AS) an affiliate of Kestra IS. CD Wealth Management and Bluespring Wealth Partners LLC* are affiliates of Kestra IS and Kestra AS. Investor Disclosures: https://bit.ly/KF-Disclosures
*Bluespring Wealth Partners, LLC acquires and supports high quality investment adviser and wealth management companies throughout the United States.
Fidelity Investments and Fidelity Institutional® (together “Fidelity”) is an independent company, unaffiliated with Kestra Financial or CD Wealth Management. Fidelity is a service provider to both. There is no form of legal partnership, agency affiliation, or similar relationship between your financial advisor and Fidelity, nor is such a relationship created or implied by the information herein. Fidelity has not been involved with the preparation of the content supplied by CD Wealth Management and does not guarantee, or assume any responsibility for, its content. Fidelity Investments is a registered service mark of FMR LLC. Fidelity Institutional provides clearing, custody, or other brokerage services through National Financial Services LLC or Fidelity Brokerage Services LLC, Members NYSE, SIPC.