It’s important for investors to understand the 10-year Treasury and the significance of the yield-curve inversion.
A yield curve is a line that plots interest rates of bonds with equal credit quality but different maturity dates. There are three main shapes of a yield curve: normal (upward sloping), inverted (downward sloping) and flat. A normal yield curve, or upward sloping, is indicative of economic expansion, while an inverted yield curve points to an economic recession.
For the past 18 months, the yield curve has been inverted as the two-year Treasury bond has yielded more than the 10-year Treasury bond. That remains the case today, but the differential has shrunk because the 10-year Treasury bond yield increased significantly over the last month. The 10-year Treasury bond recently had a yield of over 5% for the first time since 2007.
The yield curve is now relatively flat, as seen in the chart below, with bonds almost equal in yield between three years and 30 years.
Treasury Yield Curve
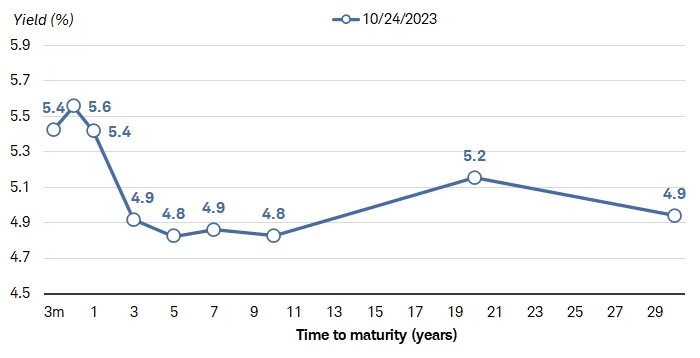
Ultra-short-term rates are yielding more than long-term rates; the Fed has been pushing short-term rates up for the past 18 months to curb inflation.
A common misconception is that when the Fed raises the Fed funds rate, all yields rise in tandem. This usually is not the case. Short-term rates are tied to the Fed funds rate, whereas longer-term rates are tied to the outlook of the economy regarding growth and inflation.
The Treasury yield curve usually slopes upward, meaning longer-term securities yield more than shorter-term securities. Investors typically demand higher yields for locking their money up for a longer period.
What is the 10-year Treasury — and why is it so important?
The 10-year Treasury is a bond that pays interest plus repayment of principal in 10 years. The yield is the current rate Treasury notes would pay investors if they bought them today. Changes in the 10-year Treasury yield tell us a lot about the current economic landscape and global market outlook.
The 10-year Treasury can indicate investor confidence in the economy. When the yield on the 10-year bond changes, it can indicate a shift across all borrowing rates, from interest rates on bonds to mortgage rates. The rising yield of the 10-year can be a barometer for interest rates on mortgages, student loans and other forms of borrowing.
Also, the 10-year Treasury typically is used as the basis to value the future cash flows of companies to determine their market value. As the 10-year moves higher, those cash flows are discounted at a larger rate — and therefore, the values of the companies are worth less, compared to when interest rates are lower.
Declines in the 10-year Treasury yield generally indicate caution about global economic conditions. Gains in the 10-year Treasury yield signal more confidence in the global economy.
Several factors affect the yield on the 10-year Treasury; inflation and investor perception of the current economy are the two main factors. When the 10-year yield goes up, so do mortgage rates and other borrowing rates. When the 10-year yield declines and mortgage rates fall, the housing market strengthens, which has a positive impact on the economy.
Higher 10-year bond yields have pushed the 30-year mortgage rates to 8% for the first time since 2000. Higher mortgage rates have hurt existing home sales, but limited housing supply has kept home prices from falling too much.
The 10-year also impacts the rate at which companies can borrow money. When the 10-year is high, like it is today, companies face more expensive borrowing costs that may reduce their ability to grow and innovate. Small businesses haven’t notably changed their capital spending plans yet, but obtaining financing going forward has become much more difficult. If businesses don’t have access to capital, that would potentially mean less investment in the future and fewer jobs.
The 10-year also can impact the stock market. Rising yields may signal that investors are looking for higher return investments, but the fear of rising rates could draw monies away from the stock market. Falling yields usually mean that borrowing rates will decline, making it easier for companies to borrow money and expand.
Global events also have an impact on Treasury yields. U.S. government bonds are considered the safest investment in the world, and when there is upheaval, Treasuries are in high demand from international investors, leading to lower yields.
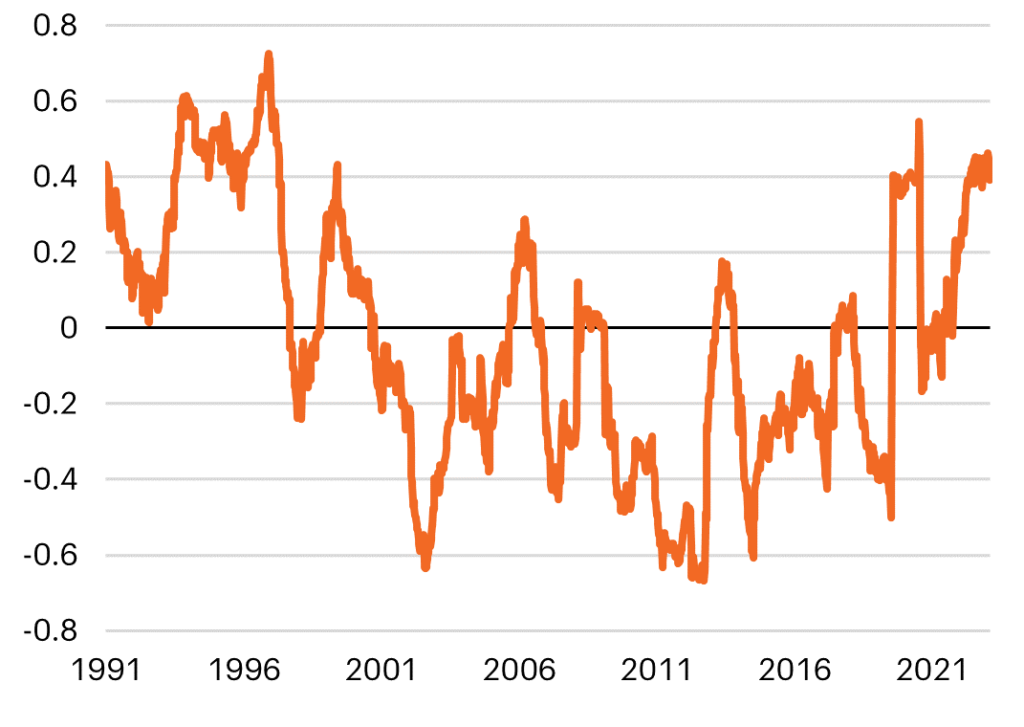
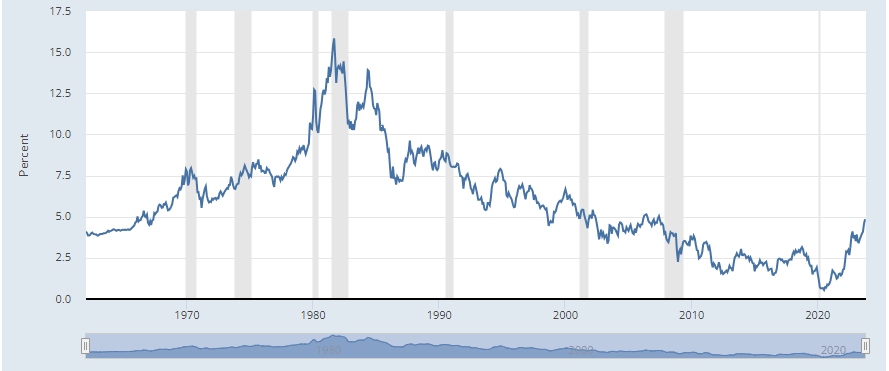
Market Yield on U.S. Treasury Securities at 10-Year Constant Maturity
Quoted on an investment basis
Why has the 10-year gone up?
The 10-year Treasury has surged since theFed ’s September report for several reasons:
• The economy remains resilient despite 11 interest-rate hikes over the last 18 months.
• GDP, a measure of all goods and services produced in the U.S., rose at a 4.9% annualized pace for the third quarter, growing faster than economists expected. The increase in GDP is due mainly to contributions from consumer spending.
• Inflation has stayed elevated at 3.7%, down considerably from the peak of 9.1%. Inflation pushes bond investors to demand higher interest rates to keep pace with rising prices.
• The federal deficit is approaching $2 trillion and growing, which may force the government to issue more bonds — pushing the price lower and rates higher.
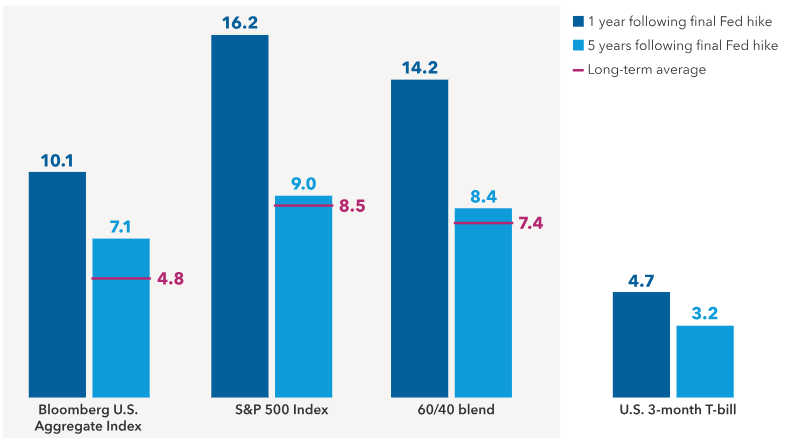
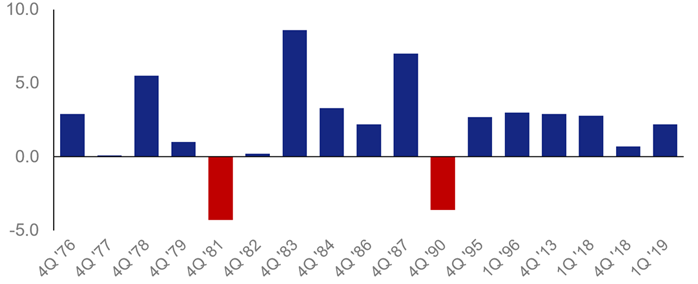
It is likely that the Fed will keep rates at an elevated level to continue to bring inflation down. The market expects the Fed to cut rates in the later part of 2024. Historically, the Fed has paused rate hikes when it believed that the economic growth was about to contract and inflation was slowing. When that occurs, longer-term Treasuries usually decline along with short-term rates, as short-term yields move in advance of what the Fed is expected to do. It may be tempting to wait in cash and see if yields move even higher.
As we write often, it is hard to time the top or bottom of the stock or bond market. We often don’t know that yields have peaked until long after it happens.
The CD Wealth Formula
We help our clients reach and maintain financial stability by following a specific plan, catered to each client.
Our focus remains on long-term investing with a strategic allocation while maintaining a tactical approach. Our decisions to make changes are calculated and well thought out, looking at where we see the economy is heading. We are not guessing or market timing. We are anticipating and moving to those areas of strength in the economy — and in the stock market.
We will continue to focus on the fact that what really matters right now is time in the market, not out of the market. That means staying the course and continuing to invest, even when the markets dip, to take advantage of potential market upturns. We continue to adhere to the tried-and-true disciplines of diversification, periodic rebalancing and looking forward, while not making investment decisions based on where we have been.
It is important to focus on the long-term goal, not on one specific data point or indicator. Long-term fundamentals are what matter. In markets and moments like these, it is essential to stick to the financial plan. Investing is about following a disciplined process over time.
Sources: Bloomberg, CNBC, Federal Reserve, Schwab, USA Today

This material contains an assessment of the market and economic environment at a specific point in time and is not intended to be a forecast of future events, or a guarantee of future results. Forward-looking statements are subject to certain risks and uncertainties. Actual results, performance, or achievements may differ materially from those expressed or implied. Information is based on data gathered from what we believe are reliable sources.
Using diversification as part of your investment strategy neither assures nor guarantees better performance and cannot protect against loss of principal due to changing market conditions.
Past performance is not a guarantee of future results.
The opinions expressed in this commentary are those of the author and may not necessarily reflect those held by Kestra Investment Services, LLC or Kestra Advisory Services, LLC. This is for general information only and is not intended to provide specific investment advice or recommendations for any individual. It is suggested that you consult your financial professional, attorney, or tax advisor with regard to your individual situation.
Securities offered through Kestra Investment Services, LLC (Kestra IS), member FINRA/SIPC. Investment Advisory Services offered through Kestra Advisory Services, LLC (Kestra AS) an affiliate of Kestra IS. CD Wealth Management and Bluespring Wealth Partners LLC* are affiliates of Kestra IS and Kestra AS. Investor Disclosures: https://bit.ly/KF-Disclosures
*Bluespring Wealth Partners, LLC acquires and supports high quality investment adviser and wealth management companies throughout the United States.
Fidelity Investments and Fidelity Institutional® (together “Fidelity”) is an independent company, unaffiliated with Kestra Financial or CD Wealth Management. Fidelity is a service provider to both. There is no form of legal partnership, agency affiliation, or similar relationship between your financial advisor and Fidelity, nor is such a relationship created or implied by the information herein. Fidelity has not been involved with the preparation of the content supplied by CD Wealth Management and does not guarantee, or assume any responsibility for, its content. Fidelity Investments is a registered service mark of FMR LLC. Fidelity Institutional provides clearing, custody, or other brokerage services through National Financial Services LLC or Fidelity Brokerage Services LLC, Members NYSE, SIPC.