One of the biggest financial storylines in 2023 was the performance of the market itself: Stocks bounced back from a difficult 2022, and though the ride wasn’t always smooth, those who stayed invested were rewarded for doing so.
Throughout the year, a number of different market themes arose — and as often is the case, some themes repeated themselves often.
ChatGPT and AI
As of January 2023, ChatGPT was the fastest-growing consumer software application in history. It is credited with starting the boom in artificial intelligence, as AI became the biggest market buzzword for the year. It seems inevitable that it will play an increasingly important role in the future economy, and investors appear to recognize the market is still in the early stages of an AI boom.
The Magnificent Seven
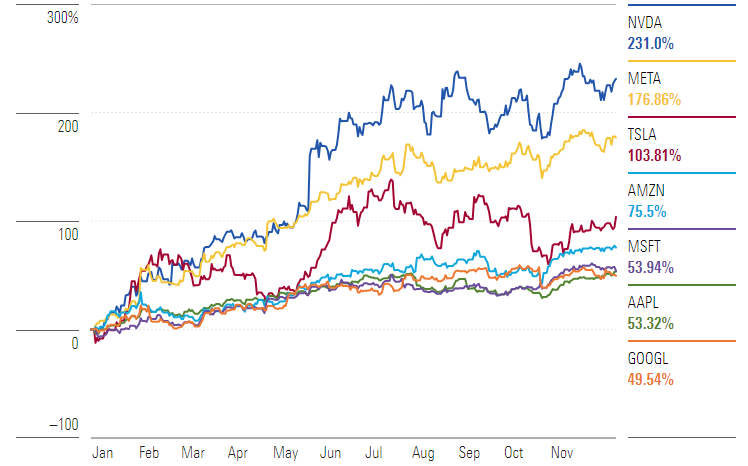
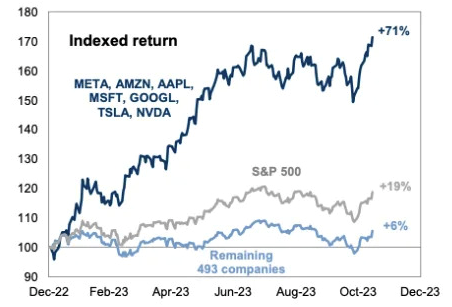
Investors loved the biggest stocks in the market, the mega-cap tech companies: Apple, Amazon, Alphabet (Google), Meta (Facebook), Microsoft, Nvidia and Tesla. All seven stocks have more than doubled the performance of the S&P 500.
Magnificent Seven Stock Performance
Data as of Dec. 14, 2023. Source: Morningstar Direct, Morningstar Indexes
Banking crisis
U.S. regional bank stocks plummeted in early March after federal regulators shut down Silicon Valley Bank, the largest bank failure since the 2008 financial crisis.
U.S. credit rating downgrade
Fitch, one of the three main credit rating agencies, downgraded the U.S. long-term credit rating to AA+ from AAA. Moody’s lowered its outlook to negative, as confidence in the U.S. government to navigate shutdowns and increased spending continued to wane.
Inflation
The Federal Reserve continued to raise interest rates in the first half of 2023. Investors finally saw signs that the Fed’s monetary policy tightening was paying off, as inflation started to decrease. CPI decreased from the peak of 9.1% in June of 2022 to 3.1% as of November 2023.
Interest rates
The Fed’s “higher rates for longer” position replaced “Don’t fight the Fed.” The Fed raised interest rates four times during 2023, the last of which was in July. At the last Fed meeting, Chairman Jerome Powell hinted that the Fed may cut interest rates at least three times next year.
Recession — yes or no?
This continues to be a heavily debated topic by Wall Street economists. If we have a recession, can the Fed engineer a “soft landing” or will it continue to be a series of rolling recessions by sector?
The CD Wealth Formula
We help our clients reach and maintain financial stability by following a specific plan, catered to each client.
Our focus remains on long-term investing with a strategic allocation while maintaining a tactical approach. Our decisions to make changes are calculated and well thought out, looking at where we see the economy is heading. We are not guessing or market timing. We are anticipating and moving to those areas of strength in the economy — and in the stock market.
We will continue to focus on the fact that what really matters right now is time in the market, not out of the market. That means staying the course and continuing to invest, even when the markets dip, to take advantage of potential market upturns. We continue to adhere to the tried-and-true disciplines of diversification, periodic rebalancing and looking forward, while not making investment decisions based on where we have been.
It is important to focus on the long-term goal, not on one specific data point or indicator. Long-term fundamentals are what matter. In markets and moments like these, it is essential to stick to the financial plan. Investing is about following a disciplined process over time.
Source: Morningstar
This material contains an assessment of the market and economic environment at a specific point in time and is not intended to be a forecast of future events, or a guarantee of future results. Forward-looking statements are subject to certain risks and uncertainties. Actual results, performance, or achievements may differ materially from those expressed or implied. Information is based on data gathered from what we believe are reliable sources.
Using diversification as part of your investment strategy neither assures nor guarantees better performance and cannot protect against loss of principal due to changing market conditions.
Past performance is not a guarantee of future results.
The opinions expressed in this commentary are those of the author and may not necessarily reflect those held by Kestra Investment Services, LLC or Kestra Advisory Services, LLC. This is for general information only and is not intended to provide specific investment advice or recommendations for any individual. It is suggested that you consult your financial professional, attorney, or tax advisor regarding your individual situation.
Securities offered through Kestra Investment Services, LLC (Kestra IS), member FINRA/SIPC. Investment Advisory Services offered through Kestra Advisory Services, LLC (Kestra AS) an affiliate of Kestra IS. CD Wealth Management and Bluespring Wealth Partners LLC* are affiliates of Kestra IS and Kestra AS.
The Santa Claus stock market rally came a little early this year. Last week, the Federal Reserve left interest rates unchanged and signaled the end of the hike cycle. The Fed acknowledged that inflation is easing faster than expected and that several Fed members favor cutting interest rates in the first half of 2024. The Fed’s statement also acknowledged that the pace of economic activity is slowing.
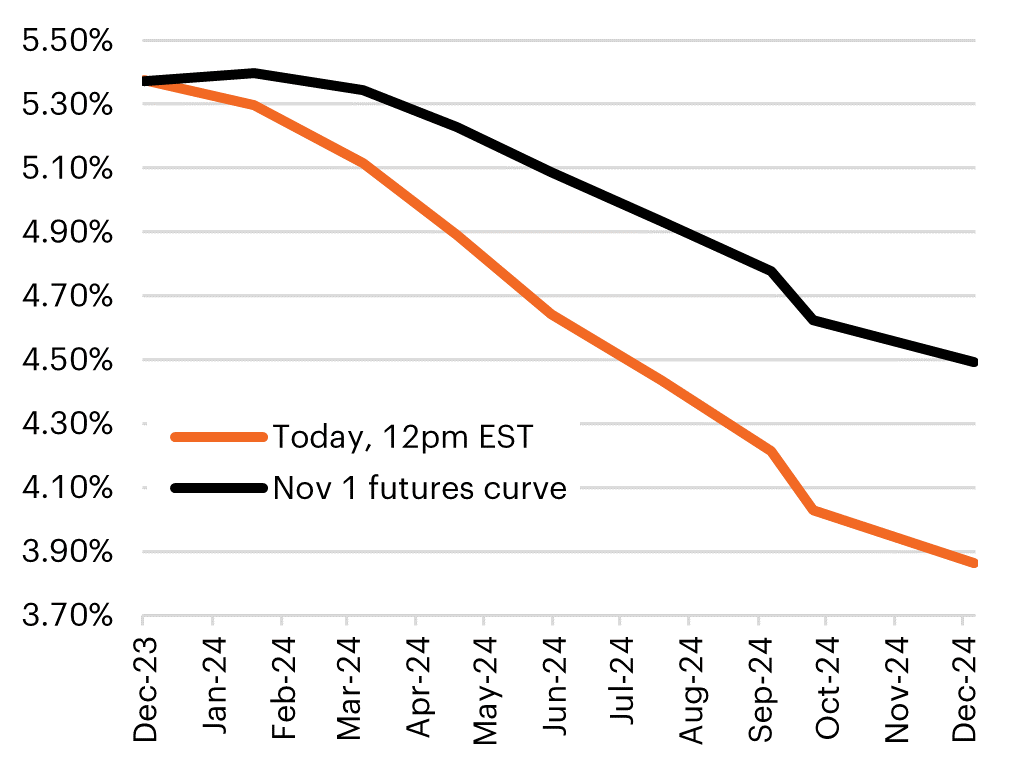
Bond yields fell on the news, and the stock market rallied. Fed Chairman Jerome Powell emphasized that the risk of not doing enough to curb inflation is now balanced with the risk of holding rates too high for too long and in turn, potentially breaking the economy in the process. As seen in the chart below, before the Fed announcement, the market wasn’t expecting an interest rate cut before the third quarter of 2024 — and now, following last week’s Fed meeting, as many as six rate cuts are being priced in next year.
Markets Expect 6 Rate Cuts in 2024
There are plenty of reasons we believe in being bullish as we head into 2024:
1. Inflation continues to show signs of moderating to the Fed’s target of 2%.
2. Interest rates are normalizing. We expect bond yields to decline in line with falling inflation and slower economic growth. This year, we saw the 10-year Treasury span a huge range from as low as 3.25% in April to as high as 5.02% in October.
3. Consumers appear to have plenty of disposable money in their pockets. Consumer spending should grow more slowly as job gains diminish, but on aggregate, financial conditions are nowhere near levels before the great financial crisis.
4. Household wealth and liquidity remain robust.
5. The U.S. government has committed more than $1.4 trillion for capital projects. This has the potential to reshape U.S. manufacturing and energy — and boost the semiconductor industry.
6. Economists are expecting corporate earnings for companies in the S&P 500 to grow by double digits in 2024. Increased earnings could provide a runway for stocks to head higher.
7. Almost $6 trillion of cash remains on the sidelines. Soaring yields in 2023 pulled cash into money market funds and other short-term instruments, such as Treasury bills and CDs. Lower rates in 2024 could force investors to move money into equities and longer-duration bonds to earn a higher rate of return as cash yields fall.
8. Artificial intelligence captured investors’ hearts this year and contributed to the outperformance of stocks led by the Magnificent Seven stocks. AI applications are spawning innovation across many industries, not just in technology companies.
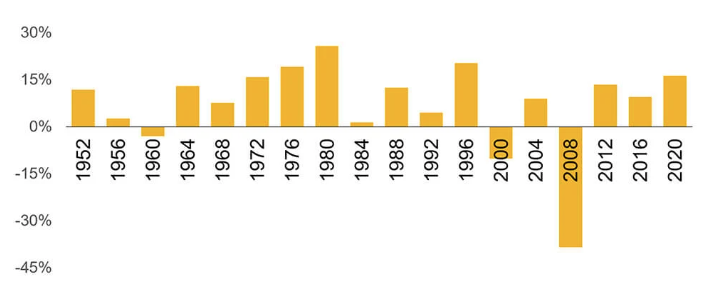
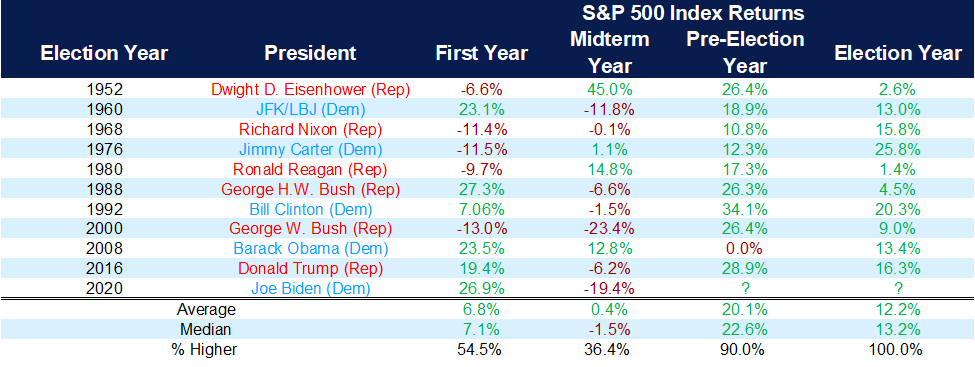
9. Presidential election years have been very good for stocks. There is a tendency among investors to worry about elections — especially now. But going back to 1952, the stock market has declined only three times in a presidential election year. In re-election years, the S&P 500 has not declined since 1948.
S&P 500 Performance Has Been Positive in Most Presidential Election Years Since 1952
Markets do not go up in a straight line, and we expect volatility to continue in 2024. Over the last five years, we have experienced two bear markets, a worldwide pandemic, high inflation and surging interest rates. All the while, the S&P 500 has doubled during this time.
The market hit an all-time high in early 2022, only to see equities and bonds fall precipitously, with both asset classes ending 2022 down big. In 2023, we saw a sharp reversal, led by the Magnificent Seven: Alphabet (Google), Amazon, Apple, Meta (Facebook), Microsoft, Nvidia and Tesla. The S&P 500 is closing in on a new all-time high as we near the end of 2023.
We have referred to the below chart before: On average, there has been at least one 10% market correction each year since 1950, and there is no reason to think that 2024 will be any different.
Volatility Is the Toll We Pay to Invest
S&P 500 per year (1950-2022)
Inflation, Fed policy, artificial intelligence and the Magnificent Seven dominated the market headlines in 2023. Those same topics, along with the upcoming presidential election, will be top of mind as we head into 2024. But over the long term, returns are driven by fundamentals and not the latest noise.
There will be lots of noise from candidates about potential policy changes that could affect retirement, estate or tax planning. It can be tempting to react in anticipation of what may happen, but you must be careful not to overreact to the news.
In the year ahead, it will be critical to remember that there are things in your control and things out of your control. Spending time and energy on the things you can control will make it easier to withstand any potential headwinds that may occur.
We look forward to the challenges and opportunities that lie ahead, and we look forward to guiding you through the upcoming year.
The CD Wealth Formula
We help our clients reach and maintain financial stability by following a specific plan, catered to each client.
Our focus remains on long-term investing with a strategic allocation while maintaining a tactical approach. Our decisions to make changes are calculated and well thought out, looking at where we see the economy is heading. We are not guessing or market timing. We are anticipating and moving to those areas of strength in the economy — and in the stock market.
We will continue to focus on the fact that what really matters right now is time in the market, not out of the market. That means staying the course and continuing to invest, even when the markets dip, to take advantage of potential market upturns. We continue to adhere to the tried-and-true disciplines of diversification, periodic rebalancing and looking forward, while not making investment decisions based on where we have been.
It is important to focus on the long-term goal, not on one specific data point or indicator. Long-term fundamentals are what matter. In markets and moments like these, it is essential to stick to the financial plan. Investing is about following a disciplined process over time.
This material contains an assessment of the market and economic environment at a specific point in time and is not intended to be a forecast of future events, or a guarantee of future results. Forward-looking statements are subject to certain risks and uncertainties. Actual results, performance, or achievements may differ materially from those expressed or implied. Information is based on data gathered from what we believe are reliable sources.
Using diversification as part of your investment strategy neither assures nor guarantees better performance and cannot protect against loss of principal due to changing market conditions.
Past performance is not a guarantee of future results.
The opinions expressed in this commentary are those of the author and may not necessarily reflect those held by Kestra Investment Services, LLC or Kestra Advisory Services, LLC. This is for general information only and is not intended to provide specific investment advice or recommendations for any individual. It is suggested that you consult your financial professional, attorney, or tax advisor with regard to your individual situation.
Securities offered through Kestra Investment Services, LLC (Kestra IS), member FINRA/SIPC. Investment Advisory Services offered through Kestra Advisory Services, LLC (Kestra AS) an affiliate of Kestra IS. CD Wealth Management and Bluespring Wealth Partners LLC* are affiliates of Kestra IS and Kestra AS. Investor Disclosures: https://bit.ly/KF-Disclosures
*Bluespring Wealth Partners, LLC acquires and supports high quality investment adviser and wealth management companies throughout the United States.
Fidelity Investments and Fidelity Institutional® (together “Fidelity”) is an independent company, unaffiliated with Kestra Financial or CD Wealth Management. Fidelity is a service provider to both. There is no form of legal partnership, agency affiliation, or similar relationship between your financial advisor and Fidelity, nor is such a relationship created or implied by the information herein. Fidelity has not been involved with the preparation of the content supplied by CD Wealth Management and does not guarantee, or assume any responsibility for, its content. Fidelity Investments is a registered service mark of FMR LLC. Fidelity Institutional provides clearing, custody, or other brokerage services through National Financial Services LLC or Fidelity Brokerage Services LLC, Members NYSE, SIPC.
As 2023 nears its end, we wanted to take this occasion to look back at the articles we’ve produced for our clients so far this year and share the 10 most popular pieces, in case you missed any of them — or if you want to revisit and share them with friends and family.
Every week, we thoughtfully craft these pieces with our clients in mind, broaching subjects we think are relevant and interesting. This is not syndicated content. We want you to find value in these letters — especially in times like these.
1. A New Bull Market Has Begun — Here’s What Investors Should Know
June 15: The S&P 500 closed more than 20% higher than its October low. For now, the 2022 bear market is over. Read more
2. 2023 at the Halfway Point: Where We’ve Been and What Lies Ahead
June 22: Here are some of the key indicators and trends we are watching for the second half of the year. Read more
3. Here Are the Portfolio Changes We’re Making as We Near the End of the Year
Nov. 9: The world in which interest rates stay higher for longer is not one we have been accustomed to for the last 15 years. Read more
4. The RMD Deadline Is Right Around the Corner — Are You Prepared?
Oct. 26: It is important to understand your options to maximize your income and avoid a costly tax mistake. Read more
5. Here’s Why Patience May Be an Investor’s Greatest Asset
Sept. 21: There will always be reasons to worry about the market, but not doing anything can be a very powerful choice. Read more
6. Understanding the 10-Year Treasury and Why It Matters to Investors
Nov. 2: The rising yield can be a barometer for interest rates on mortgages, student loans and other forms of borrowing. Read more
7. The Portfolio Changes We’re Making as We Enter the Third Quarter of 2023
June 29: The market is watching to see if a recession unfolds, caused by interest rate hikes, inflation and remaining effects of the banking crisis. Read more
8. Turning Investment Losses into Gains: The Art of Tax-Loss Harvesting
Oct. 20: Not every investment will be a winner, but sometimes an investment that has lost money can still do some good. Read more
9. What Does the Fed’s ‘Higher-for-Longer’ Stance Mean for Investors?
Sept. 28: The Fed is working hard not to allow inflation to rear its head again, after it has steadily declined over the last six months. Read more
10. Don’t Wait Until Retirement to Learn About Medicare — Here’s What You Should Know
July 20: For many people, the cost of healthcare is the biggest unknown for retirement planning. Read more
The CD Wealth Formula
We help our clients reach and maintain financial stability by following a specific plan, catered to each client.
Our focus remains on long-term investing with a strategic allocation while maintaining a tactical approach. Our decisions to make changes are calculated and well thought out, looking at where we see the economy is heading. We are not guessing or market timing. We are anticipating and moving to those areas of strength in the economy — and in the stock market.
We will continue to focus on the fact that what really matters right now is time in the market, not out of the market. That means staying the course and continuing to invest, even when the markets dip, to take advantage of potential market upturns. We continue to adhere to the tried-and-true disciplines of diversification, periodic rebalancing and looking forward, while not making investment decisions based on where we have been.
It is important to focus on the long-term goal, not on one specific data point or indicator. Long-term fundamentals are what matter. In markets and moments like these, it is essential to stick to the financial plan. Investing is about following a disciplined process over time.
This material contains an assessment of the market and economic environment at a specific point in time and is not intended to be a forecast of future events, or a guarantee of future results. Forward-looking statements are subject to certain risks and uncertainties. Actual results, performance, or achievements may differ materially from those expressed or implied. Information is based on data gathered from what we believe are reliable sources.
Using diversification as part of your investment strategy neither assures nor guarantees better performance and cannot protect against loss of principal due to changing market conditions.
Past performance is not a guarantee of future results.
The opinions expressed in this commentary are those of the author and may not necessarily reflect those held by Kestra Investment Services, LLC or Kestra Advisory Services, LLC. This is for general information only and is not intended to provide specific investment advice or recommendations for any individual. It is suggested that you consult your financial professional, attorney, or tax advisor with regard to your individual situation.
Securities offered through Kestra Investment Services, LLC (Kestra IS), member FINRA/SIPC. Investment Advisory Services offered through Kestra Advisory Services, LLC (Kestra AS) an affiliate of Kestra IS. CD Wealth Management and Bluespring Wealth Partners LLC* are affiliates of Kestra IS and Kestra AS. Investor Disclosures: https://bit.ly/KF-Disclosures
*Bluespring Wealth Partners, LLC acquires and supports high quality investment adviser and wealth management companies throughout the United States.
Fidelity Investments and Fidelity Institutional® (together “Fidelity”) is an independent company, unaffiliated with Kestra Financial or CD Wealth Management. Fidelity is a service provider to both. There is no form of legal partnership, agency affiliation, or similar relationship between your financial advisor and Fidelity, nor is such a relationship created or implied by the information herein. Fidelity has not been involved with the preparation of the content supplied by CD Wealth Management and does not guarantee, or assume any responsibility for, its content. Fidelity Investments is a registered service mark of FMR LLC. Fidelity Institutional provides clearing, custody, or other brokerage services through National Financial Services LLC or Fidelity Brokerage Services LLC, Members NYSE, SIPC.
Only a month ago, stocks were in correction mode and fear was everywhere. Economists and emotional investors worried aloud about a new bear market and a recession on the horizon.
How quickly the narrative changes.
November saw a complete reversal, with stocks having their best month of the year. The S&P 500 finished November up 8.9%, one of its best monthly returns ever!
What led to this rally? Investor sentiment had become very pessimistic, as often is the case when stocks are in a correction mode. All it took for the market to rally was a little spark, and that spark came in the form of encouraging inflation data.
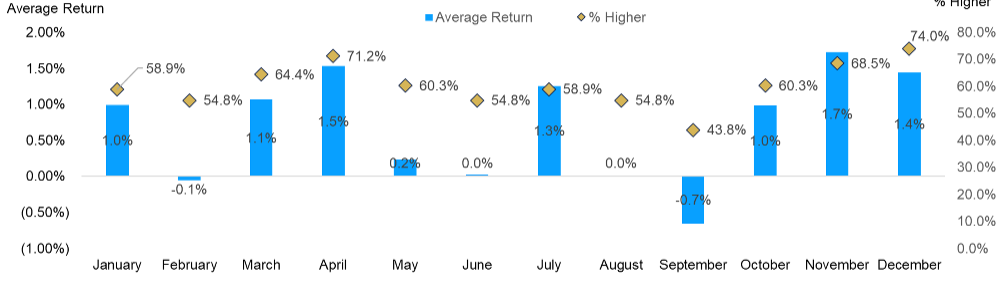
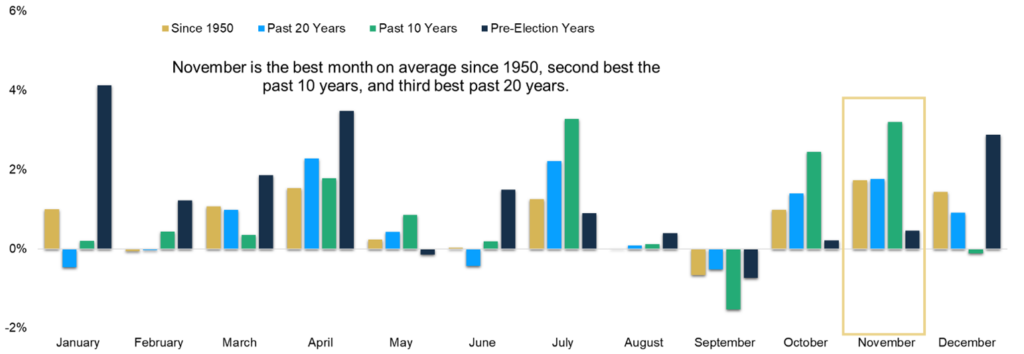
The market now believes that the Fed is probably through raising rates, and the likelihood of interest rate cuts next year has increased. There may be more good news on the horizon as well: History shows us that no month has been stronger than December. The chart below shows us that since 1950, the market in December has been positive 74% of the time with an average gain of 1.4%.
December Is Higher More Often Than Any Other Month
S&P 500 average monthly performance and how often each month is higher (1950-present)
Santa’s financial gifts are not always in the form of market returns. The IRS recently released its inflation adjustments for 2024 related to personal income tax, retirement contributions, estate taxes and Social Security benefits. While these changes won’t affect your tax return that’s due in April, they will be helpful in planning for 2024.
Personal Income Tax
The standard deductions are increasing in 2024, which potentially means a bigger tax break for you. The new standard deductions for 2024 are:
• Married filing jointly: $29,000 (an increase of $1,500) • Single taxpayers and married individuals filing separately: $14,600 (an increase of $750) • Heads of households: $21,900 (an increase of $1,100)
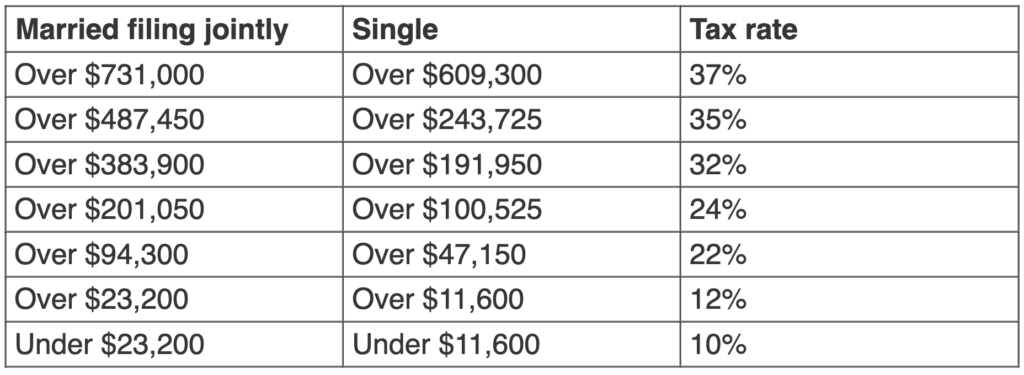
For the 2024 tax year, the top tax rate remains 37% for those with income greater than $731,000 for married filing jointly ($609,300 for single taxpayers). Here are all of the brackets:
In addition, retired married couples over 65 who file jointly will receive an additional standard deduction of $3,100 ($1,550 each)! This may make it more difficult to itemize deductions in 2024. We will want to keep this in mind when planning charitable giving and considering a bunching strategy.
Retirement Savings Contributions
The contribution limit for a 401(k) is increasing by $500 to $23,000, and maximum contribution for certain profit-sharing plans is increasing to $69,000. For the second year in a row, limits for contributions to traditional and Roth IRAs are increasing. For those under the age of 50, the cap will be $7,000 in 2024, up from $6,500.
Married couples with income below $230,000 will be able to make a full Roth contribution in 2024 ($146,000 for those who are single). However, phaseout ranges are unchanged, so couples with income over $240,000 will not be eligible to contribute to a Roth IRA.
The back-door Roth IRA option remains a viable option. The first step is to contribute to a traditional IRA; this will be a non-deductible contribution. After the traditional IRA contribution is completed, you can convert those funds to a Roth IRA (if the original contribution to a traditional IRA was not deductible, then the conversion of that amount is non-taxable).
However, any growth on that amount between the contribution and the conversion dates would be taxable. Completing the back-door Roth transaction can be a tricky process; you will want to consult your financial advisor and CPA.
Please make sure you adjust your 401(k) plan to account for the increased contribution limit.
Social Security
Social Security benefits will increase 3.2% in 2024, an average of almost $60 more per month. This represents the third-largest increase since 2011 but remains well below the 8.7% increase last year.
Estate Taxes and Gifting
The gift tax annual exclusion is increasing from $17,000 to $18,000 for 2024. This is the third consecutive increase to the gifting limit. You can gift up to this amount to any number of individuals in 2024 without incurring gift tax or using any of the taxpayer’s lifetime exemption. Married couples can use this exemption, allowing them to gift up to $36,000 annually to each recipient in 2024.
In addition, the lifetime exemption amount increased about $700,000 per person, to $13.61 million per individual. This increase means that a married couple can shield a total of $27.22 million from federal estate or gift tax. This exemption is set to sunset by about 50% at the beginning of 2026. Remember, however, that certain kinds of planning strategies can take months or even years to implement.
The end of the year is a perfect time to review your financial planning needs. This includes reviewing the investment portfolio, assessing year-end tax planning opportunities, reviewing retirement goals, and managing your legacy plans. The above changes for 2024 may apply to you and your family. We are happy to meet to discuss any of the above to ensure that you remain on track with your financial goals.
The CD Wealth Formula
We help our clients reach and maintain financial stability by following a specific plan, catered to each client.
Our focus remains on long-term investing with a strategic allocation while maintaining a tactical approach. Our decisions to make changes are calculated and well thought out, looking at where we see the economy is heading. We are not guessing or market timing. We are anticipating and moving to those areas of strength in the economy — and in the stock market.
We will continue to focus on the fact that what really matters right now is time in the market, not out of the market. That means staying the course and continuing to invest, even when the markets dip, to take advantage of potential market upturns. We continue to adhere to the tried-and-true disciplines of diversification, periodic rebalancing and looking forward, while not making investment decisions based on where we have been.
It is important to focus on the long-term goal, not on one specific data point or indicator. Long-term fundamentals are what matter. In markets and moments like these, it is essential to stick to the financial plan. Investing is about following a disciplined process over time.
Sources: Baird, Carson
This material contains an assessment of the market and economic environment at a specific point in time and is not intended to be a forecast of future events, or a guarantee of future results. Forward-looking statements are subject to certain risks and uncertainties. Actual results, performance, or achievements may differ materially from those expressed or implied. Information is based on data gathered from what we believe are reliable sources.
Using diversification as part of your investment strategy neither assures nor guarantees better performance and cannot protect against loss of principal due to changing market conditions.
Past performance is not a guarantee of future results.
The opinions expressed in this commentary are those of the author and may not necessarily reflect those held by Kestra Investment Services, LLC or Kestra Advisory Services, LLC. This is for general information only and is not intended to provide specific investment advice or recommendations for any individual. It is suggested that you consult your financial professional, attorney, or tax advisor with regard to your individual situation.
Securities offered through Kestra Investment Services, LLC (Kestra IS), member FINRA/SIPC. Investment Advisory Services offered through Kestra Advisory Services, LLC (Kestra AS) an affiliate of Kestra IS. CD Wealth Management and Bluespring Wealth Partners LLC* are affiliates of Kestra IS and Kestra AS. Investor Disclosures: https://bit.ly/KF-Disclosures
*Bluespring Wealth Partners, LLC acquires and supports high quality investment adviser and wealth management companies throughout the United States.
Fidelity Investments and Fidelity Institutional® (together “Fidelity”) is an independent company, unaffiliated with Kestra Financial or CD Wealth Management. Fidelity is a service provider to both. There is no form of legal partnership, agency affiliation, or similar relationship between your financial advisor and Fidelity, nor is such a relationship created or implied by the information herein. Fidelity has not been involved with the preparation of the content supplied by CD Wealth Management and does not guarantee, or assume any responsibility for, its content. Fidelity Investments is a registered service mark of FMR LLC. Fidelity Institutional provides clearing, custody, or other brokerage services through National Financial Services LLC or Fidelity Brokerage Services LLC, Members NYSE, SIPC.
As we begin to wrap up the year, it is the perfect time to review year-end planning strategies to ensure that your wealth plan reflects any changes in your circumstances or goals, the current tax environment and the economic landscape. The end of the year is an important time for making financial decisions that can have an impact not only in the new year ahead, but for years to come.
Here are a few high-level takeaways from 2023:
The Magnificent 7 Roar Ahead
Amazon, Apple, Google (Alphabet), Meta, Microsoft, Nvidia and Tesla make up 29% of the S&P 500 market cap and have driven most of the U.S. stock market performance in 2023. Remember: These same stocks were down over 45% on average in 2022. For those investors who didn’t panic and held onto these stocks, patience paid off.
Sources: FactSet, Goldman Sachs Global Investment Research
Recession or No Recession?
This year may be remembered for the most anticipated recession in history that didn’t happen. Investors fluctuated on when and if a recession may occur. What we did see was recessions in different sectors, such as commercial real estate and housing, but not for the overall economy.
The Fed vs. Inflation
The Federal Reserve hiked interest rates an additional four times in 2023, with the Fed Funds rate ending the year at 5.25%, a 22-year high. The old mantra of “Don’t fight the Fed” gave way to “higher interest rates for longer.” The Fed has reiterated all year that its inflation target is 2% and that it will do what it needs to do to bring inflation down.
The Rise of AI
Artificial Intelligence has captured investors’ minds and has contributed to the outperformance of both the Magnificent 7 and technology stocks as a whole. During second-quarter earnings calls, 35% of companies in the S&P 500 mentioned AI. This moderated some in the third quarter as only 29% of companies discussed AI, but very strong momentum remains heading into 2024.
Earning Money on Cash
Money market yields reached their highest levels since 2007 with the Fed raising the Fed funds rate. For fixed-income investors, returns on Treasuries, CDs and bonds provided attractive levels to lock in higher yields for longer.
Year-End Checklist
As we near 2024, we recommend that you review the checklist below for planning strategies to consider and discuss.
Income Tax Strategies
• Traditional year-end planning focuses on deferring income to a future year and accelerating deductions into the current year.
• If you anticipate that your marginal income tax bracket will increase, you may consider accelerating income into 2023 and deferring deductions to 2024.
• If you anticipate being in a lower tax bracket next year: — Defer income if possible in order to postpone paying the tax and have that income at a lower bracket. — If you itemize on your tax return, bunch your medical expenses in the current year to meet the percentage of your adjusted gross income to claim those deductions. — Make your January mortgage payment in December so that you can deduct the interest on this year’s return.
Tax-Related Investment Strategies
• Tax-loss harvesting is the strategy of selling securities at a loss to offset a capital gain liability, either for today or in the future. — Harvest losses by selling taxable investments. (You must wait at least 31 days before buying back a holding sold for a loss to avoid the IRS wash-sale rule.) — Harvest gains by selling taxable investments if you have a tax loss carryforward.
• Ensure that you have satisfied your required minimum distributions (RMD). — If you fail to take your RMD, this may result in a 50% penalty. — If you own an inherited IRA, an RMD may be required separately for that account as well.
Retirement Planning Strategies
• Maximize your IRA contributions. You may be able to deduct annual contributions of up to $6,500 to your traditional IRA and $6,500 to your spouse’s IRA ($7,500 if over age 50).
• Make a Roth IRA contribution if under the applicable income limits.
• Consider increasing or maximizing your 401(k) contribution. This year, the maximum contribution is $22,500 for those under 50 and $30,000 for those over the age of 50. Boosting contributions to your 401(k) can lower your adjusted gross income while increasing your retirement savings.
• Consider making contributions to a Roth 401(k) if your plan allows.
• Consider setting up a Roth IRA for each of your children who have earned income during the year.
Gifting Strategies
• Consider making gifts up to $17,000 per person as allowed under the federal annual gift tax exclusion. You can give up to $17,000 this year to as many people as you want without triggering gift taxes. Payments made directly to educational and/or medical institutions on behalf of your intended beneficiary do not count towards your annual exclusion amount or against your lifetime estate tax exclusion.
• Create a donor advised fund for an immediate income tax deduction and provide immediate and future benefits to charity over time.
• If you already have a donor advised fund or want to donate to a charity, consider gifting appreciated assets that have been held longer than one year to get the fair market value income tax deduction while avoiding income tax on the appreciation.
• If you are over the age of 70½, consider making a direct transfer from an IRA to a public charity. The distribution is excluded from gross income, and you can give up to $100,000 as a tax-free gift from your IRA, which may fully satisfy RMD requirements.
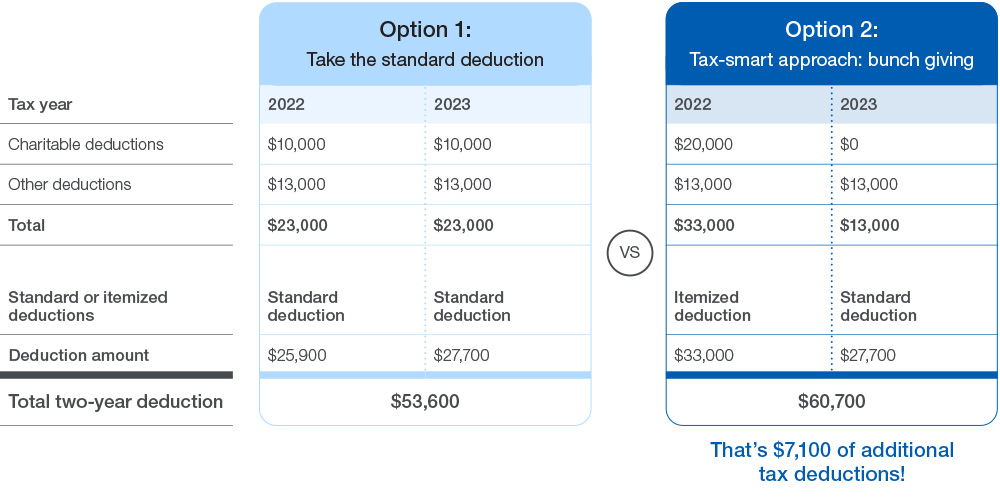
• Consider combining multiple years of charitable giving into a single year to exceed the standard deduction threshold. This is called “bunching.” The chart below reflects the bunching strategy and how it can reduce taxes if executed properly.
Wrapping Up 2023, Planning for 2024
• Discuss major life events with CD Wealth Management to confirm you have clarity in your current situation.
• Communicate with your CPA to provide capital gains and investment income information for a more accurate year-end projection.
• Check your Health Savings Account (HSA) contributions for 2023. If you qualify, you can contribute up to $3,850 (individual) or $7,750 (family) — and an additional $1,000 catch-up if you are over the age of 55.
• Double-check your beneficiary designations for retirement plans, IRAs, Roth IRAs, annuities, life insurance policies, etc.
• If you do not already have identity theft protection, consider purchasing a service to help protect you and your family.
The end of the year is a perfect time to review your financial planning needs, including reviewing the investment portfolio, assessing year-end tax planning opportunities, reviewing retirement goals and managing your legacy plans.
The checklist above includes just some of the items that may apply to you and your family. We are happy to meet to discuss any of the above to ensure that you remain on track with your financial goals.
The CD Wealth Formula
We help our clients reach and maintain financial stability by following a specific plan, catered to each client.
Our focus remains on long-term investing with a strategic allocation while maintaining a tactical approach. Our decisions to make changes are calculated and well thought out, looking at where we see the economy is heading. We are not guessing or market timing. We are anticipating and moving to those areas of strength in the economy — and in the stock market.
We will continue to focus on the fact that what really matters right now is time in the market, not out of the market. That means staying the course and continuing to invest, even when the markets dip, to take advantage of potential market upturns. We continue to adhere to the tried-and-true disciplines of diversification, periodic rebalancing and looking forward, while not making investment decisions based on where we have been.
It is important to focus on the long-term goal, not on one specific data point or indicator. Long-term fundamentals are what matter. In markets and moments like these, it is essential to stick to the financial plan. Investing is about following a disciplined process over time.
Sources: FactSet, Goldman Sachs, Schwab
This material contains an assessment of the market and economic environment at a specific point in time and is not intended to be a forecast of future events, or a guarantee of future results. Forward-looking statements are subject to certain risks and uncertainties. Actual results, performance, or achievements may differ materially from those expressed or implied. Information is based on data gathered from what we believe are reliable sources.
Using diversification as part of your investment strategy neither assures nor guarantees better performance and cannot protect against loss of principal due to changing market conditions.
Past performance is not a guarantee of future results.
The opinions expressed in this commentary are those of the author and may not necessarily reflect those held by Kestra Investment Services, LLC or Kestra Advisory Services, LLC. This is for general information only and is not intended to provide specific investment advice or recommendations for any individual. It is suggested that you consult your financial professional, attorney, or tax advisor with regard to your individual situation.
Securities offered through Kestra Investment Services, LLC (Kestra IS), member FINRA/SIPC. Investment Advisory Services offered through Kestra Advisory Services, LLC (Kestra AS) an affiliate of Kestra IS. CD Wealth Management and Bluespring Wealth Partners LLC* are affiliates of Kestra IS and Kestra AS. Investor Disclosures: https://bit.ly/KF-Disclosures
*Bluespring Wealth Partners, LLC acquires and supports high quality investment adviser and wealth management companies throughout the United States.
Fidelity Investments and Fidelity Institutional® (together “Fidelity”) is an independent company, unaffiliated with Kestra Financial or CD Wealth Management. Fidelity is a service provider to both. There is no form of legal partnership, agency affiliation, or similar relationship between your financial advisor and Fidelity, nor is such a relationship created or implied by the information herein. Fidelity has not been involved with the preparation of the content supplied by CD Wealth Management and does not guarantee, or assume any responsibility for, its content. Fidelity Investments is a registered service mark of FMR LLC. Fidelity Institutional provides clearing, custody, or other brokerage services through National Financial Services LLC or Fidelity Brokerage Services LLC, Members NYSE, SIPC.
The stock and bond markets continue to hinge on the Federal Reserve’s battle against inflation. From September to October, inflation remained flat, as tracked by Consumer Price Index (CPI). This report came as gasoline prices fell 5% for the month, which in turns means that households have more money to spend.
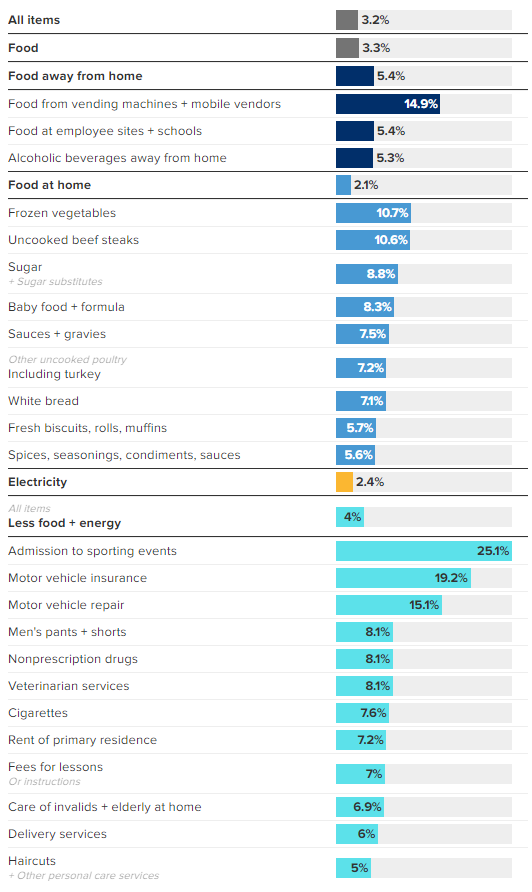
CPI, which measures a broad basket of goods and services and is a key barometer for tracking and measuring inflation, increased 3.2% from a year ago. The chart below shows price changes for core categories year over year.
What’s not in the chart is shelter, which is the average household’s biggest expense. This has accounted for more than 70% of the total year-over-year increase in CPI. Most inflationary pressures still stem from the pandemic and the imbalance between supply and demand.
Inflation Breakdown for October 2023
These are some of the core categories, plus other items with notable year-over-year price changes.
Note: Not seasonally adjusted. Items in bold represent major consumer price index categories. Source: U.S. Bureau of Labor Statistics’ consumer price index as of Nov. 14, 2023. Table: Gabriel Cortes/CNBC
Supply chains were totally thrown off during the pandemic, driving up prices for goods at the same time consumers were flush with cash. Since then, supply chains have returned to normal, but it takes time for prices to ease. The annual level is the lowest in two years but still above the Fed’s 2% tracking level. Both the stock and bond markets are sending signals that the Fed is through raising rates, but the data continues to send conflicting signals.
Last week, Fed Chairman Jerome Powell said the Fed remains unconvinced that it has done enough to get inflation down to the 2% annual rate and won’t hesitate to raise rates if needed. Uncertainty remains over how long the Fed will keep the benchmark rate at its current levels.
After we saw the best week of the year for stocks two weeks ago, the market continued to show strength last week with another strong market return. Following the release of the CPI number on Tuesday, the stock and bond markets rallied. If inflation remains on a sustainable path lower, the Fed may cut rates sooner than expected in 2024.
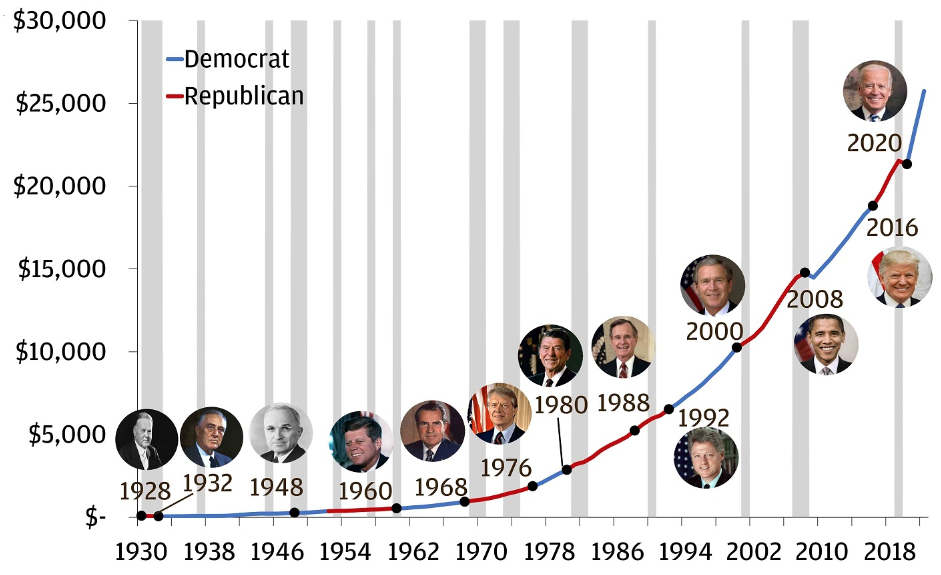
If the Fed were to cut interest rates earlier than expected, we could see the stock market trend higher. With 2024 being an election year, the Fed probably will tread lightly so as not to influence the vote. An interesting side note: For the last 10 new presidents, stocks have been higher during an election year, with an average return of 12.2%.
Stocks Have Never Been Lower in an Election Year Under a New President
S&P 500 performance under new presidents (1950-current)
We understand that elections can cause anxiety over who may win and what may happen. Elections can impact the economy and the markets based on each candidate’s proposals, but it is far too early to outline what that may look like. What we must keep in mind is that the economy has continued to grow throughout every presidency in our nation’s history.
Market volatility may increase because we don’t know who will be in the White House, but stocks tend to forge ahead as uncertainty fades. Elections seem like a big deal in the moment, but historically they have had little bearing on what paths the economy and the market ultimately will take.
The U.S. Economy Has Continued to Grow Regardless of Who Is in the White House
U.S. Nominal Gross Domestic Product (GDP), USD billions
Source: BEA, Haver Analytics, White House History, J.P. Morgan Wealth Management. Data as of Q3 2023. Party indicator is that of the serving president at the time. Markers only represent election years (intra-term presidents not pictured).
We will continue to beat the drum next year to remind our clients that what matters most is the macro economy, not who may or may not win the election. Evidence is becoming clearer that the economy will avoid a hard recession — and may avoid a recession altogether. That does not mean that there are not risks, especially with the conflict in the Middle East and Ukraine, but regardless of which way the election swings, opportunities are always present.
Based on the likely scenario that the Fed is through with rate hikes, the most readily apparent consideration is that yields typically fall soon after. This means that cash will carry reinvestment rate risk. In other words, when the Fed begins to lower rates, money market rates will drop as well. If you are waiting to deploy cash due to higher money market rates, know that it may be too late to put that money to work into either stocks or bonds once the Fed cuts rates.
The CD Wealth Formula
We help our clients reach and maintain financial stability by following a specific plan, catered to each client.
Our focus remains on long-term investing with a strategic allocation while maintaining a tactical approach. Our decisions to make changes are calculated and well thought out, looking at where we see the economy is heading. We are not guessing or market timing. We are anticipating and moving to those areas of strength in the economy — and in the stock market.
We will continue to focus on the fact that what really matters right now is time in the market, not out of the market. That means staying the course and continuing to invest, even when the markets dip, to take advantage of potential market upturns. We continue to adhere to the tried-and-true disciplines of diversification, periodic rebalancing and looking forward, while not making investment decisions based on where we have been.
It is important to focus on the long-term goal, not on one specific data point or indicator. Long-term fundamentals are what matter. In markets and moments like these, it is essential to stick to the financial plan. Investing is about following a disciplined process over time.
Sources: Carson, CNBC, JP Morgan
This material contains an assessment of the market and economic environment at a specific point in time and is not intended to be a forecast of future events, or a guarantee of future results. Forward-looking statements are subject to certain risks and uncertainties. Actual results, performance, or achievements may differ materially from those expressed or implied. Information is based on data gathered from what we believe are reliable sources.
Using diversification as part of your investment strategy neither assures nor guarantees better performance and cannot protect against loss of principal due to changing market conditions.
Past performance is not a guarantee of future results.
The opinions expressed in this commentary are those of the author and may not necessarily reflect those held by Kestra Investment Services, LLC or Kestra Advisory Services, LLC. This is for general information only and is not intended to provide specific investment advice or recommendations for any individual. It is suggested that you consult your financial professional, attorney, or tax advisor with regard to your individual situation.
Securities offered through Kestra Investment Services, LLC (Kestra IS), member FINRA/SIPC. Investment Advisory Services offered through Kestra Advisory Services, LLC (Kestra AS) an affiliate of Kestra IS. CD Wealth Management and Bluespring Wealth Partners LLC* are affiliates of Kestra IS and Kestra AS. Investor Disclosures: https://bit.ly/KF-Disclosures
*Bluespring Wealth Partners, LLC acquires and supports high quality investment adviser and wealth management companies throughout the United States.
Fidelity Investments and Fidelity Institutional® (together “Fidelity”) is an independent company, unaffiliated with Kestra Financial or CD Wealth Management. Fidelity is a service provider to both. There is no form of legal partnership, agency affiliation, or similar relationship between your financial advisor and Fidelity, nor is such a relationship created or implied by the information herein. Fidelity has not been involved with the preparation of the content supplied by CD Wealth Management and does not guarantee, or assume any responsibility for, its content. Fidelity Investments is a registered service mark of FMR LLC. Fidelity Institutional provides clearing, custody, or other brokerage services through National Financial Services LLC or Fidelity Brokerage Services LLC, Members NYSE, SIPC.
The Federal Reserve kept the benchmark Federal Funds Rate unchanged for the second meeting in a row. As we wrote last week, Treasury yields have risen sharply since September. Longer maturity bonds had taken the brunt of the pain over the last few months, as the 10-year Treasury briefly eclipsed the 5% level, which had not been seen since 2007.
Along with the pain in the bond market, the stock market experienced a correction with stocks down more than 10% from their recent peak. Investors may still have some PTSD from 2022, when both stocks and bonds were down at the same time, but that was a rare occurrence.
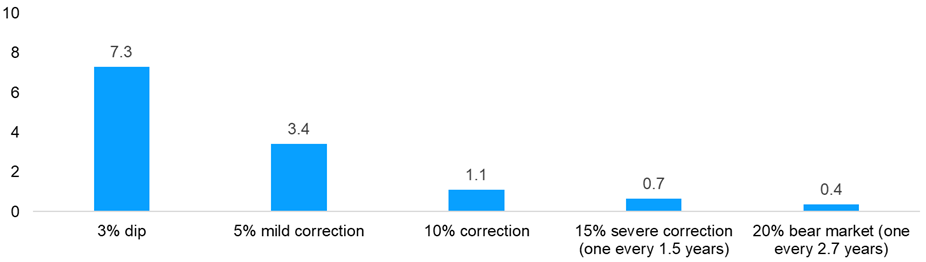
Market corrections are normal. There have been corrections in 22 of the past 44 years, and according to Ned Davis research, there are 1.1 corrections per year on average going back to 1950. This suggests that the market falling 10% or more in a year is a normal occurrence, but each time it happens, the occurrence feels unique.
Volatility Is the Toll We Pay to Invest
S&P 500 per year (1950-2022)
Sources: Carson Investment Research, Ned Davis Research
Last week, the stock and bond markets rallied after the Fed announcement and the weaker-than-expected payroll report, which limited concerns of a recession. The 10-year Treasury bond yield fell to almost 4.5%, well off the recent 5% yield reached two weeks ago. As bond yields fell, stocks surged, marking the best week of the year.
Historically, November and December have been strong months in the market, and November has been the best month of the year, gaining 1.7% on average. The strength in the month of November may be tied to the fact that August, September and October have historically been the weakest three-month stretch of the year. Another interesting tidbit: December has been strong in pre-election years, which is the case this year as we head into 2024.
From a portfolio management perspective, we continue to look ahead. The markets are forward-looking, often telling us what may happen ahead of time. We continue to watch and wait for the most anticipated recession in history. Inflation continues to show signs of weakening but remains persistently — and stubbornly — above the targeted 2% level.
With an eye on the future, we are making the following portfolio changes as we end the year:
1. Through the end of October, only two sectors had positive year-to-date returns: technology and consumer discretionary. Every other sector was negative. The “Magnificent Seven” tech stocks — Alphabet, Amazon, Apple, Meta, Microsoft, Nvidia and Tesla — were the main reason the S&P 500 had a positive return through October. The broadening of the market away from those seven names had yet to materialize.
Healthcare, which historically has been a sector to own in a struggling economy, has been underperforming over the last several years. This is partly due to pressures on drug pricing as well as higher interest rates hurting less profitable companies in the faster-growing biotechnology space. We have decided to reduce our exposure to healthcare and move those monies to a holding that focuses on companies that display positive fundamentals: return on equity, stable earnings growth and lower financial leverage.
2. We have continued to increase the duration of the fixed-income portfolio as interest rates have continued to climb. The longer-dated maturities at the end of the yield curve are more volatile than the short end of the yield curve.
For example, in the chart below, let’s start by looking at the 5-Year Treasury row and the 0-bps column (4.58%). If interest rates were to rise by 100 basis points (1%), you would theoretically earn 1.08% over that time frame. However, if interest rates dropped by 50 basis points (.50%) in the next year, you would earn 6.39% in total.
By comparison, let’s look at the 10-year Treasury bond, a longer maturity bond than the 5-year Treasury. If rates were to rise by 1%, you would lose 2.64%; if rates were to fall by .5%, the potential rate of return would be 8.25%. Because we believe we are near the end of the Fed rate increases, we are continuing to extend the duration of the portfolio and increase the credit quality by adding a position in longer-dated Treasuries. We believe that when rates fall, we will be able to capture nice income along with capital appreciation from rising bond prices.
Interest Rate Scenario Analysis
This analysis illustrates the total return of the U.S. Treasury security of a set maturity, over a given time period and a range of interest rate shifts.
Source: U.S. Treasury
We continue to reposition the portfolio in response to where we think the puck is moving. The world in which interest rates stay higher for longer is not one we have been accustomed to for the last 15 years. Financial markets, both stocks and bonds, may be more volatile in response.
With higher yields for longer periods, investors are being compensated in cash through money market and CDs. However, as soon as the Fed lowers the Federal Funds Rate, we will see those yields fall rapidly. We think much of the pain from rising interest rates is behind us, and the key to navigating volatility still is to be in a diversified portfolio. We will continue to monitor the portfolio and make changes to skate toward the puck, rather than wait for the puck to come to us.
The CD Wealth Formula
We help our clients reach and maintain financial stability by following a specific plan, catered to each client.
Our focus remains on long-term investing with a strategic allocation while maintaining a tactical approach. Our decisions to make changes are calculated and well thought out, looking at where we see the economy is heading. We are not guessing or market timing. We are anticipating and moving to those areas of strength in the economy — and in the stock market.
We will continue to focus on the fact that what really matters right now is time in the market, not out of the market. That means staying the course and continuing to invest, even when the markets dip, to take advantage of potential market upturns. We continue to adhere to the tried-and-true disciplines of diversification, periodic rebalancing and looking forward, while not making investment decisions based on where we have been.
It is important to focus on the long-term goal, not on one specific data point or indicator. Long-term fundamentals are what matter. In markets and moments like these, it is essential to stick to the financial plan. Investing is about following a disciplined process over time.
Sources: Bloomberg, Carson, CNBC, Ned Davis, Wealth of Common Sense
This material contains an assessment of the market and economic environment at a specific point in time and is not intended to be a forecast of future events, or a guarantee of future results. Forward-looking statements are subject to certain risks and uncertainties. Actual results, performance, or achievements may differ materially from those expressed or implied. Information is based on data gathered from what we believe are reliable sources.
Using diversification as part of your investment strategy neither assures nor guarantees better performance and cannot protect against loss of principal due to changing market conditions.
Past performance is not a guarantee of future results.
The opinions expressed in this commentary are those of the author and may not necessarily reflect those held by Kestra Investment Services, LLC or Kestra Advisory Services, LLC. This is for general information only and is not intended to provide specific investment advice or recommendations for any individual. It is suggested that you consult your financial professional, attorney, or tax advisor with regard to your individual situation.
Securities offered through Kestra Investment Services, LLC (Kestra IS), member FINRA/SIPC. Investment Advisory Services offered through Kestra Advisory Services, LLC (Kestra AS) an affiliate of Kestra IS. CD Wealth Management and Bluespring Wealth Partners LLC* are affiliates of Kestra IS and Kestra AS. Investor Disclosures: https://bit.ly/KF-Disclosures
*Bluespring Wealth Partners, LLC acquires and supports high quality investment adviser and wealth management companies throughout the United States.
Fidelity Investments and Fidelity Institutional® (together “Fidelity”) is an independent company, unaffiliated with Kestra Financial or CD Wealth Management. Fidelity is a service provider to both. There is no form of legal partnership, agency affiliation, or similar relationship between your financial advisor and Fidelity, nor is such a relationship created or implied by the information herein. Fidelity has not been involved with the preparation of the content supplied by CD Wealth Management and does not guarantee, or assume any responsibility for, its content. Fidelity Investments is a registered service mark of FMR LLC. Fidelity Institutional provides clearing, custody, or other brokerage services through National Financial Services LLC or Fidelity Brokerage Services LLC, Members NYSE, SIPC.
It’s important for investors to understand the 10-year Treasury and the significance of the yield-curve inversion.
A yield curve is a line that plots interest rates of bonds with equal credit quality but different maturity dates. There are three main shapes of a yield curve: normal (upward sloping), inverted (downward sloping) and flat. A normal yield curve, or upward sloping, is indicative of economic expansion, while an inverted yield curve points to an economic recession.
For the past 18 months, the yield curve has been inverted as the two-year Treasury bond has yielded more than the 10-year Treasury bond. That remains the case today, but the differential has shrunk because the 10-year Treasury bond yield increased significantly over the last month. The 10-year Treasury bond recently had a yield of over 5% for the first time since 2007.
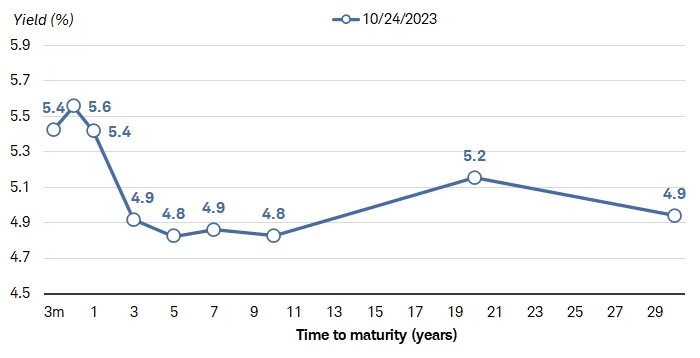
The yield curve is now relatively flat, as seen in the chart below, with bonds almost equal in yield between three years and 30 years.
Treasury Yield Curve
Source: Bloomberg. Treasury yield curve as of 10/24/2023. Past performance is no guarantee of future results.
Ultra-short-term rates are yielding more than long-term rates; the Fed has been pushing short-term rates up for the past 18 months to curb inflation.
A common misconception is that when the Fed raises the Fed funds rate, all yields rise in tandem. This usually is not the case. Short-term rates are tied to the Fed funds rate, whereas longer-term rates are tied to the outlook of the economy regarding growth and inflation.
The Treasury yield curve usually slopes upward, meaning longer-term securities yield more than shorter-term securities. Investors typically demand higher yields for locking their money up for a longer period.
What is the 10-year Treasury — and why is it so important?
The 10-year Treasury is a bond that pays interest plus repayment of principal in 10 years. The yield is the current rate Treasury notes would pay investors if they bought them today. Changes in the 10-year Treasury yield tell us a lot about the current economic landscape and global market outlook.
The 10-year Treasury can indicate investor confidence in the economy. When the yield on the 10-year bond changes, it can indicate a shift across all borrowing rates, from interest rates on bonds to mortgage rates. The rising yield of the 10-year can be a barometer for interest rates on mortgages, student loans and other forms of borrowing.
Also, the 10-year Treasury typically is used as the basis to value the future cash flows of companies to determine their market value. As the 10-year moves higher, those cash flows are discounted at a larger rate — and therefore, the values of the companies are worth less, compared to when interest rates are lower.
Declines in the 10-year Treasury yield generally indicate caution about global economic conditions. Gains in the 10-year Treasury yield signal more confidence in the global economy.
Several factors affect the yield on the 10-year Treasury; inflation and investor perception of the current economy are the two main factors. When the 10-year yield goes up, so do mortgage rates and other borrowing rates. When the 10-year yield declines and mortgage rates fall, the housing market strengthens, which has a positive impact on the economy.
Higher 10-year bond yields have pushed the 30-year mortgage rates to 8% for the first time since 2000. Higher mortgage rates have hurt existing home sales, but limited housing supply has kept home prices from falling too much.
The 10-year also impacts the rate at which companies can borrow money. When the 10-year is high, like it is today, companies face more expensive borrowing costs that may reduce their ability to grow and innovate. Small businesses haven’t notably changed their capital spending plans yet, but obtaining financing going forward has become much more difficult. If businesses don’t have access to capital, that would potentially mean less investment in the future and fewer jobs.
The 10-year also can impact the stock market. Rising yields may signal that investors are looking for higher return investments, but the fear of rising rates could draw monies away from the stock market. Falling yields usually mean that borrowing rates will decline, making it easier for companies to borrow money and expand.
Global events also have an impact on Treasury yields. U.S. government bonds are considered the safest investment in the world, and when there is upheaval, Treasuries are in high demand from international investors, leading to lower yields.
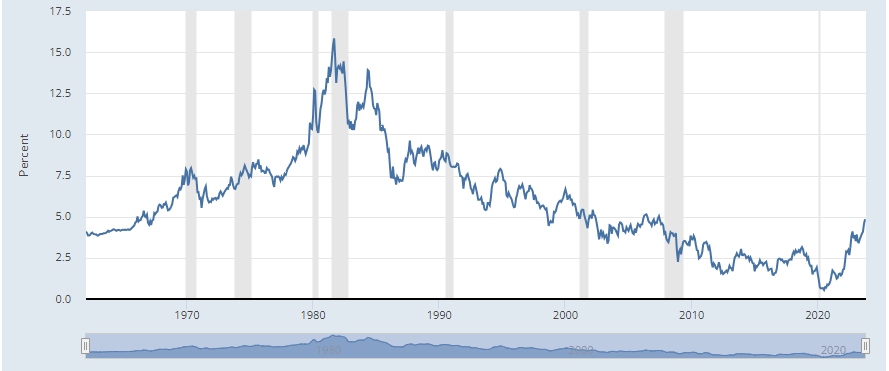
Market Yield on U.S. Treasury Securities at 10-Year Constant Maturity
Quoted on an investment basis
Source: Board of Governors of the Federal Reserve System (U.S.), Federal Reserve Economic Data
• The economy remains resilient despite 11 interest-rate hikes over the last 18 months.
• GDP, a measure of all goods and services produced in the U.S., rose at a 4.9% annualized pace for the third quarter, growing faster than economists expected. The increase in GDP is due mainly to contributions from consumer spending.
• Inflation has stayed elevated at 3.7%, down considerably from the peak of 9.1%. Inflation pushes bond investors to demand higher interest rates to keep pace with rising prices.
• The federal deficit is approaching $2 trillion and growing, which may force the government to issue more bonds — pushing the price lower and rates higher.
It is likely that the Fed will keep rates at an elevated level to continue to bring inflation down. The market expects the Fed to cut rates in the later part of 2024. Historically, the Fed has paused rate hikes when it believed that the economic growth was about to contract and inflation was slowing. When that occurs, longer-term Treasuries usually decline along with short-term rates, as short-term yields move in advance of what the Fed is expected to do. It may be tempting to wait in cash and see if yields move even higher.
As we write often, it is hard to time the top or bottom of the stock or bond market. We often don’t know that yields have peaked until long after it happens.
The CD Wealth Formula
We help our clients reach and maintain financial stability by following a specific plan, catered to each client.
Our focus remains on long-term investing with a strategic allocation while maintaining a tactical approach. Our decisions to make changes are calculated and well thought out, looking at where we see the economy is heading. We are not guessing or market timing. We are anticipating and moving to those areas of strength in the economy — and in the stock market.
We will continue to focus on the fact that what really matters right now is time in the market, not out of the market. That means staying the course and continuing to invest, even when the markets dip, to take advantage of potential market upturns. We continue to adhere to the tried-and-true disciplines of diversification, periodic rebalancing and looking forward, while not making investment decisions based on where we have been.
It is important to focus on the long-term goal, not on one specific data point or indicator. Long-term fundamentals are what matter. In markets and moments like these, it is essential to stick to the financial plan. Investing is about following a disciplined process over time.
Sources: Bloomberg, CNBC, Federal Reserve, Schwab, USA Today
This material contains an assessment of the market and economic environment at a specific point in time and is not intended to be a forecast of future events, or a guarantee of future results. Forward-looking statements are subject to certain risks and uncertainties. Actual results, performance, or achievements may differ materially from those expressed or implied. Information is based on data gathered from what we believe are reliable sources.
Using diversification as part of your investment strategy neither assures nor guarantees better performance and cannot protect against loss of principal due to changing market conditions.
Past performance is not a guarantee of future results.
The opinions expressed in this commentary are those of the author and may not necessarily reflect those held by Kestra Investment Services, LLC or Kestra Advisory Services, LLC. This is for general information only and is not intended to provide specific investment advice or recommendations for any individual. It is suggested that you consult your financial professional, attorney, or tax advisor with regard to your individual situation.
Securities offered through Kestra Investment Services, LLC (Kestra IS), member FINRA/SIPC. Investment Advisory Services offered through Kestra Advisory Services, LLC (Kestra AS) an affiliate of Kestra IS. CD Wealth Management and Bluespring Wealth Partners LLC* are affiliates of Kestra IS and Kestra AS. Investor Disclosures: https://bit.ly/KF-Disclosures
*Bluespring Wealth Partners, LLC acquires and supports high quality investment adviser and wealth management companies throughout the United States.
Fidelity Investments and Fidelity Institutional® (together “Fidelity”) is an independent company, unaffiliated with Kestra Financial or CD Wealth Management. Fidelity is a service provider to both. There is no form of legal partnership, agency affiliation, or similar relationship between your financial advisor and Fidelity, nor is such a relationship created or implied by the information herein. Fidelity has not been involved with the preparation of the content supplied by CD Wealth Management and does not guarantee, or assume any responsibility for, its content. Fidelity Investments is a registered service mark of FMR LLC. Fidelity Institutional provides clearing, custody, or other brokerage services through National Financial Services LLC or Fidelity Brokerage Services LLC, Members NYSE, SIPC.
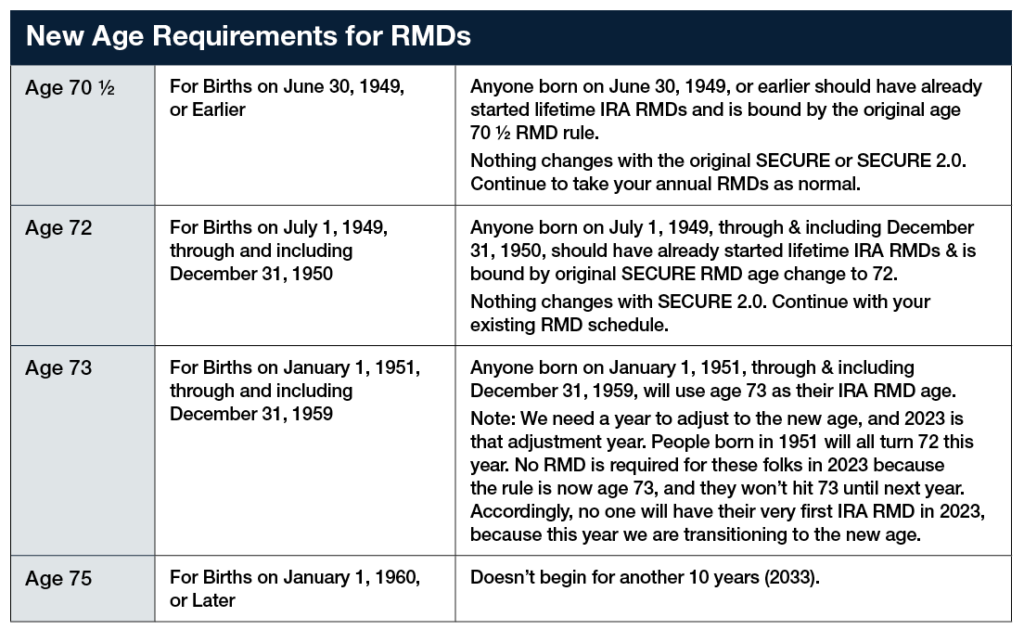
As we near the end of the year, you may have recently received a letter outlining the required minimum distribution (RMD) that you must take from your retirement accounts if you are of a certain age. Once you reach age 73, you are required to withdraw a certain amount of money from your retirement accounts, such as 401(k), 403(b), 457(b), Traditional IRAs, SEP IRAs and Simple IRAs.
The age at which an RMD is required can be confusing; the rules have gone through several recent changes. An easier way to think of this is that anyone born in 1950 or earlier will have an RMD this year. Anyone born in 1951 or later will not. (The chart below outlines the new age requirements.) As part of the SECURE ACT 2.0, which was enacted at the end of last year, those born after 1960 will be able to delay their RMD until age 75.
Sources: Slott Report; IRA RMD Age Made Easy
What is an RMD?
A required minimum distribution is a yearly mandatory withdrawal from tax-deferred retirement accounts that starts when an account owner reaches the age outlined above. The deadline for taking the RMD is Dec. 31 each year. However, if you are taking your first RMD, you have the option to delay until April 1 in the year following the year you reach age 73.
Why do RMDs exist?
If you have been saving part of your income in a tax-deferred account, you have not paid income tax on those dollars. The government lets you delay paying taxes until you reach a certain age, but it requires you take a distribution (taxed as ordinary income) once you reach that age.
For investors, the benefit of tax deferral is that while we know we will pay income tax eventually on those dollars, we can hopefully pay less tax in retirement than we would during our working years. However, it is not unusual for people to find themselves in the same tax bracket – or even a higher one in retirement.
Income from investments outside retirement accounts, combined with Social Security and RMDs, can add up — and the difference in tax brackets may not be as big as once projected when comparing retirement and non-retirement income.
How much am I required to withdraw?
Your RMD will vary each year; it is based on the account value on Dec. 31 of the previous year. The IRS calculates RMDs by taking the sum of your tax-deferred retirement accounts and dividing it by a number based on life expectancy. The life expectancy factor increases every year, so as you grow older you are required to take out more money. The cost of miscalculating or failing to withdraw the RMD can result in an IRS penalty equal to 25% of the amount not taken on time.
If I have multiple retirement accounts, can I withdraw my total RMD from one of my accounts?
If you have multiple retirement accounts, it is possible to take your RMD from one account, but it also depends on the type of accounts. For example, if you have multiple IRAs (traditional, rollover, SEP and Simple), you must calculate the total amount of RMD for each account separately, but you can withdraw the total RMD from one or any combination of the accounts. For 403(b) and 401(k) accounts, you much calculate the RMD separately for each account, and take the RMD from each account separately. Amounts withdrawn beyond the RMD amount do not reduce RMD in future years.
How are RMDs taxed — and how can I minimize the tax impact?
The RMD amount is taxed as ordinary income — and as a result, it may be subject to both federal and state taxes. If you are 70½ or older, you can contribute up to $100,000 per year in a qualified charitable donation (QCD). For married couples, each spouse can make a QCD up to $100,000. QCDs can be made only to certain charitable organizations — not to donor advised funds.
Depending on your tax bracket, it may make sense to take money out of your retirement account before age 73. Once you reach age 59½, you can take money out of retirement accounts without a 10% penalty for early withdrawal, but you still will owe taxes on the money taken out.
It is important to spend time with your financial team so you understand your options to maximize your income and avoid a costly tax mistake.
The CD Wealth Formula
We help our clients reach and maintain financial stability by following a specific plan, catered to each client.
Our focus remains on long-term investing with a strategic allocation while maintaining a tactical approach. Our decisions to make changes are calculated and well thought out, looking at where we see the economy is heading. We are not guessing or market timing. We are anticipating and moving to those areas of strength in the economy — and in the stock market.
We will continue to focus on the fact that what really matters right now is time in the market, not out of the market. That means staying the course and continuing to invest, even when the markets dip, to take advantage of potential market upturns. We continue to adhere to the tried-and-true disciplines of diversification, periodic rebalancing and looking forward, while not making investment decisions based on where we have been.
It is important to focus on the long-term goal, not on one specific data point or indicator. Long-term fundamentals are what matter. In markets and moments like these, it is essential to stick to the financial plan. Investing is about following a disciplined process over time.
Sources: Slott Report; IRA RMD Age Made Easy
This material contains an assessment of the market and economic environment at a specific point in time and is not intended to be a forecast of future events, or a guarantee of future results. Forward-looking statements are subject to certain risks and uncertainties. Actual results, performance, or achievements may differ materially from those expressed or implied. Information is based on data gathered from what we believe are reliable sources.
Using diversification as part of your investment strategy neither assures nor guarantees better performance and cannot protect against loss of principal due to changing market conditions.
Past performance is not a guarantee of future results.
The opinions expressed in this commentary are those of the author and may not necessarily reflect those held by Kestra Investment Services, LLC or Kestra Advisory Services, LLC. This is for general information only and is not intended to provide specific investment advice or recommendations for any individual. It is suggested that you consult your financial professional, attorney, or tax advisor with regard to your individual situation.
Securities offered through Kestra Investment Services, LLC (Kestra IS), member FINRA/SIPC. Investment Advisory Services offered through Kestra Advisory Services, LLC (Kestra AS) an affiliate of Kestra IS. CD Wealth Management and Bluespring Wealth Partners LLC* are affiliates of Kestra IS and Kestra AS. Investor Disclosures: https://bit.ly/KF-Disclosures
*Bluespring Wealth Partners, LLC acquires and supports high quality investment adviser and wealth management companies throughout the United States.
Fidelity Investments and Fidelity Institutional® (together “Fidelity”) is an independent company, unaffiliated with Kestra Financial or CD Wealth Management. Fidelity is a service provider to both. There is no form of legal partnership, agency affiliation, or similar relationship between your financial advisor and Fidelity, nor is such a relationship created or implied by the information herein. Fidelity has not been involved with the preparation of the content supplied by CD Wealth Management and does not guarantee, or assume any responsibility for, its content. Fidelity Investments is a registered service mark of FMR LLC. Fidelity Institutional provides clearing, custody, or other brokerage services through National Financial Services LLC or Fidelity Brokerage Services LLC, Members NYSE, SIPC.
The fall season is a great reminder to harvest. Not every investment will be a winner, but sometimes an investment that has lost money can still do some good.
With both stocks and bonds down in value last year, investors saw numerous opportunities to take advantage of tax-loss harvesting. Even in years where stocks and bonds are up in value, there may be opportunities to harvest losses — especially in a diversified portfolio, where not all asset classes move in the same direction.
What Is the Silver Lining of a Bad Investment?
You may be able to use your loss to lower your tax liability and better position your portfolio going forward. This strategy is called tax-loss harvesting. The principles behind tax-loss harvesting are straightforward, but there are potential dangers if not done properly.
Tax-loss harvesting allows you to sell investments that are down in value, replace them with similar investments and then offset realized investment gains with those losses. This helps reduce your tax burden and keeps more money to be invested in the hopes of making up for the losses.
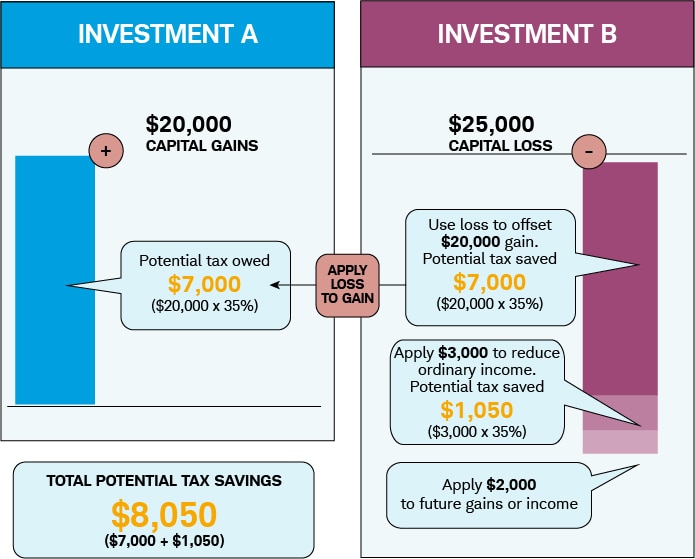
For example: If you had an investment with a short-term gain of $20,000 and you were to sell that investment, you potentially would owe $7,000 in taxes (assuming a 35% ordinary income tax bracket). However, if you had another investment with a $25,000 loss, you could sell that holding at a loss to offset the holding with the gain.
In this instance, as shown in the chart below, you would not owe the $7,000 gain and would save an additional $1,050 by using an extra $3,000 of losses to offset additional gains.
Capital gains are the profits you realize when you sell an investment for more than what you paid for it, while capital losses are the losses you realize when you sell an investment for less than what you paid. Short-term capital gains are taxed at an ordinary income rate, while long-term capital gains are taxed at a lower capital gains rate.
Long-term capital gains and losses are realized after selling investments that are held longer than one year. Short-term capital gains and losses are those realized from the sale of investments that owned for one year or less. The key difference between short- and long-term gains is the rate at which they are taxed.
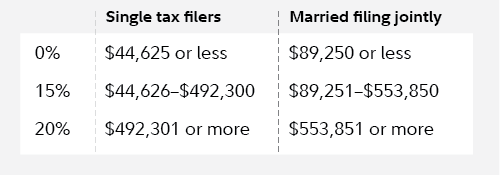
As seen in the chart below, those who have income of less than $89,250 (married filing jointly) may not pay capital gains tax at all. This can be a big benefit for tax planning as well.
Long-Term Capital Gains Rate for 2023
An investment loss can be used for different reasons:
1. The losses can be used to offset investment gains, either today or in the future. Short-term losses can be used to offset short-term gains, and long-term losses can be used to offset long-term gains. The least effective use of short-term losses is to apply them to long-term gains, but this may still be preferable to paying long-term capital gains tax.
2. The losses can help offset $3,000 of income on a joint tax return in one year. Unused losses can be carried forward indefinitely. Realizing a capital loss can be effective, even if you didn’t realize capital gains in that year with the carryover provision.
If you have mutual fund investments, your short- and long-term gains may be in the form of mutual fund distributions. Harvested losses can be used to offset these gains. Short-term capital gain distributions from mutual funds are treated as ordinary income for tax purposes. Unlike short term capital gains resulting from the sale of securities held directly, the investor cannot offset them with capital losses.
The Wash-Sale Rule
When performing tax-loss harvesting, one must be aware of the wash-sale rule. The wash-sale rule states that if you sell a security, fund or ETF for a loss and buy the same or substantially identical security within 30 days after the sale, the loss will be disallowed for tax purposes.
For example, if you own IVV, iShares Core S&P 500 ETF and sell it for a loss, and then purchase SPY, SPDR S&P 500 ETF with the proceeds, the IRS will most likely deem this to be a wash-sale violation, and you will not be able to take advantage of the realized loss. This applies across different accounts: You cannot sell an investment for a loss in one account and buy it back in another account, such as an IRA or spouse’s account.
As always, we recommend that you consult with a CPA if you have questions. If the IRS determines that you have violated the wash-sale rule, the loss is disallowed and added to the cost basis of the new investment.
While no one wants to see their portfolio value decrease, rebalancing the portfolio to create some tax losses can be beneficial to offset future gains or current income. Tax-loss harvesting and portfolio rebalancing are important investment principles that go hand in hand. If you choose to try tax-loss harvesting, be sure to keep in mind that tax savings should not undermine the investment goal.
The CD Wealth Formula
We help our clients reach and maintain financial stability by following a specific plan, catered to each client.
Our focus remains on long-term investing with a strategic allocation while maintaining a tactical approach. Our decisions to make changes are calculated and well thought out, looking at where we see the economy is heading. We are not guessing or market timing. We are anticipating and moving to those areas of strength in the economy — and in the stock market.
We will continue to focus on the fact that what really matters right now is time in the market, not out of the market. That means staying the course and continuing to invest, even when the markets dip, to take advantage of potential market upturns. We continue to adhere to the tried-and-true disciplines of diversification, periodic rebalancing and looking forward, while not making investment decisions based on where we have been.
It is important to focus on the long-term goal, not on one specific data point or indicator. Long-term fundamentals are what matter. In markets and moments like these, it is essential to stick to the financial plan. Investing is about following a disciplined process over time.
Sources: Fidelity, Schwab
This material contains an assessment of the market and economic environment at a specific point in time and is not intended to be a forecast of future events, or a guarantee of future results. Forward-looking statements are subject to certain risks and uncertainties. Actual results, performance, or achievements may differ materially from those expressed or implied. Information is based on data gathered from what we believe are reliable sources.
Using diversification as part of your investment strategy neither assures nor guarantees better performance and cannot protect against loss of principal due to changing market conditions.
Past performance is not a guarantee of future results.
The opinions expressed in this commentary are those of the author and may not necessarily reflect those held by Kestra Investment Services, LLC or Kestra Advisory Services, LLC. This is for general information only and is not intended to provide specific investment advice or recommendations for any individual. It is suggested that you consult your financial professional, attorney, or tax advisor with regard to your individual situation.
Securities offered through Kestra Investment Services, LLC (Kestra IS), member FINRA/SIPC. Investment Advisory Services offered through Kestra Advisory Services, LLC (Kestra AS) an affiliate of Kestra IS. CD Wealth Management and Bluespring Wealth Partners LLC* are affiliates of Kestra IS and Kestra AS. Investor Disclosures: https://bit.ly/KF-Disclosures
*Bluespring Wealth Partners, LLC acquires and supports high quality investment adviser and wealth management companies throughout the United States.
Fidelity Investments and Fidelity Institutional® (together “Fidelity”) is an independent company, unaffiliated with Kestra Financial or CD Wealth Management. Fidelity is a service provider to both. There is no form of legal partnership, agency affiliation, or similar relationship between your financial advisor and Fidelity, nor is such a relationship created or implied by the information herein. Fidelity has not been involved with the preparation of the content supplied by CD Wealth Management and does not guarantee, or assume any responsibility for, its content. Fidelity Investments is a registered service mark of FMR LLC. Fidelity Institutional provides clearing, custody, or other brokerage services through National Financial Services LLC or Fidelity Brokerage Services LLC, Members NYSE, SIPC.