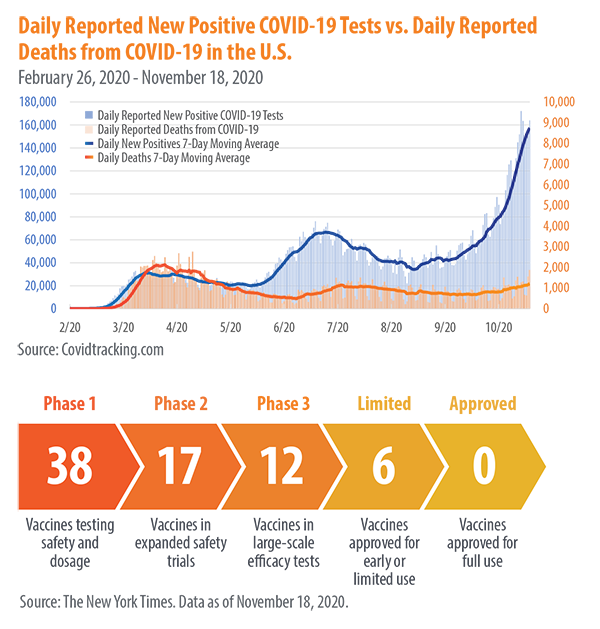
A new administration took office this week with a renewed focus on vaccinating millions of Americans and on creating additional stimulus to help those most in need. Last week, President Biden announced a proposed $1.9 trillion economic stimulus package, which would follow the recent $900 billion package passed in December. More Americans are receiving the coronavirus vaccination every day. The successful deployment of vaccines remains the key driver of U.S. economic growth for 2021. If Johnson & Johnson is able to win FDA approval for its vaccine by March, we believe the goal of vaccinating 100 million people by the early fall is attainable. These are positives for the stock market long-term.
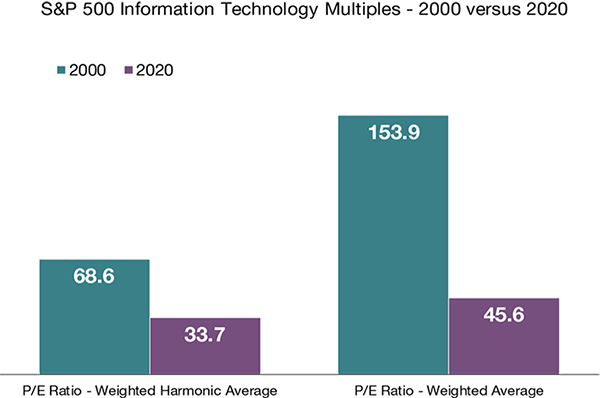
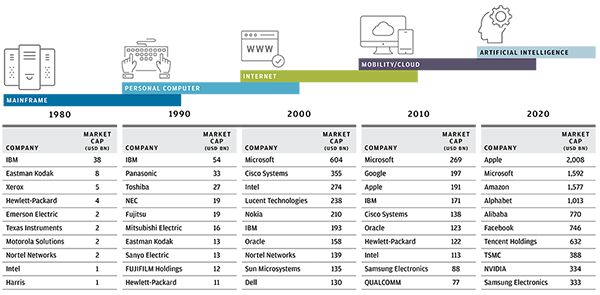
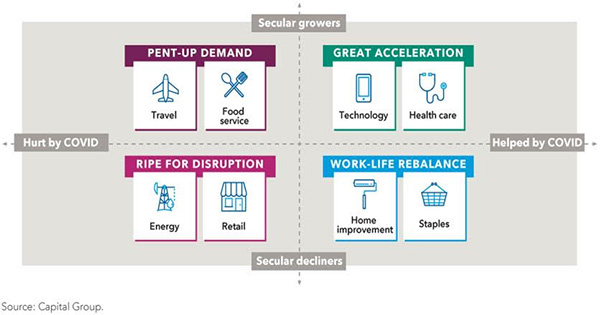
The pandemic has forced companies big and small to prioritize and expand their digital footprints. The economy will look very different after the pandemic than it did at the start of 2020. Digital business models are expanding beyond the U.S., as companies in both emerging and developed markets have rapidly expanded their platforms. Small and mid-sized companies, as well as international and emerging markets, can benefit greatly from the technological advancements and the reopening of the economy.
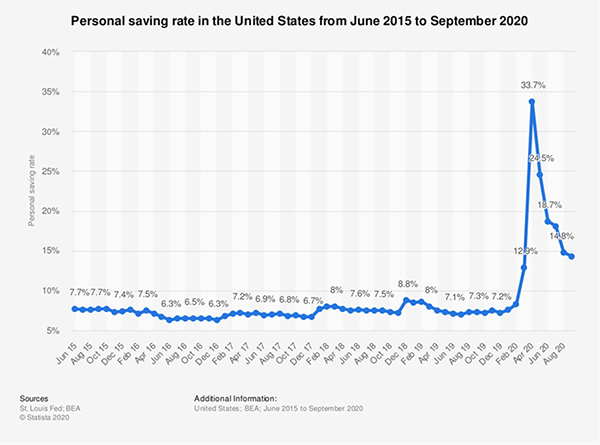
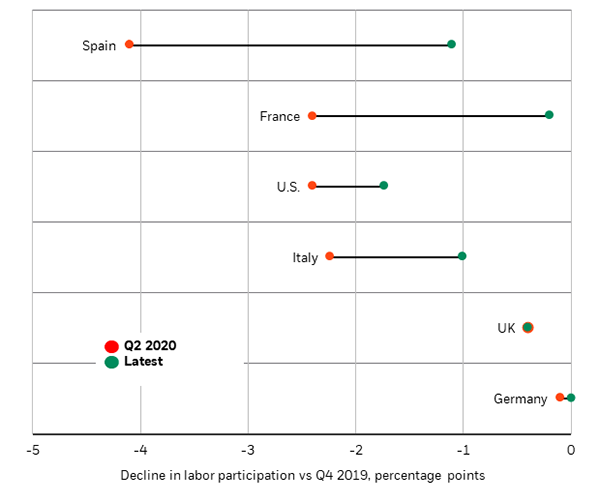
The pandemic also has accelerated shifts in employment, particularly with respect to services sectors that employ low-skilled workers. The share of permanent job losses continues to grow over time, and labor participation rates have yet to recover, as seen in the chart below.
The shock has caused more strain for smaller companies that do not have access to the same capital markets as large companies to raise additional monies to operate their businesses. The Federal Reserve bank and further economic stimulus proposed by the new administration are set to provide an additional bridge of funds for these companies, with the hope of bringing back activity to pre-pandemic levels.
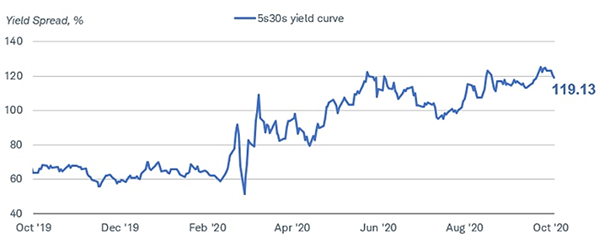
In 2021, much depends on the increase in debt through additional stimulus. Rising debt ratios may put additional pressure on the Federal Reserve Bank to keep debt service payments lower through continued lower rates. The Consumer Price Index, the measure of inflation, increased in December, due to higher gas prices. However, this increase was in line with expectations and was not as high as many were expecting. Investors’ demands for bonds remain high as a source of diversification, and demand for municipal bonds has increased as investors in the highest tax brackets anticipate higher tax rates, making those bonds more attractive.
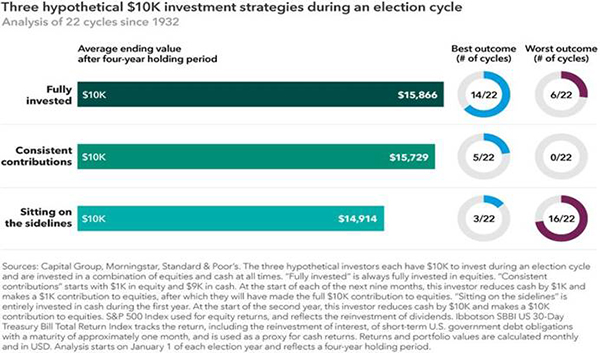
So, what can we learn from all this? We will continue to stay the course. While we know there will be bumps in the road in 2021, we also know public markets will continue to look forward, anticipating what’s ahead. From an investment perspective, we use the above insights to help with the strategic and tactical asset allocation based on where we see the portfolio heading over the next five to seven years, with short-term adjustments along the way. We are not trying to time the market, but we will try to take advantage when we see where the market is heading. Having a well-balanced, diversified, liquid portfolio and a financial plan are keys to successful investing. The best option is to stick with a broadly diversified portfolio that can help you achieve your own specific financial goals – regardless of market volatility. Long-term fundamentals are what matter.

Sources: Capital Group, Blackrock
_____
This material contains an assessment of the market and economic environment at a specific point in time and is not intended to be a forecast of future events, or a guarantee of future results. Forward-looking statements are subject to certain risks and uncertainties. Actual results, performance, or achievements may differ materially from those expressed or implied. Information is based on data gathered from what we believe are reliable sources.
Using diversification as part of your investment strategy neither assures nor guarantees better performance and cannot protect against loss of principal due to changing market conditions.
Past performance is not a guarantee of future results.
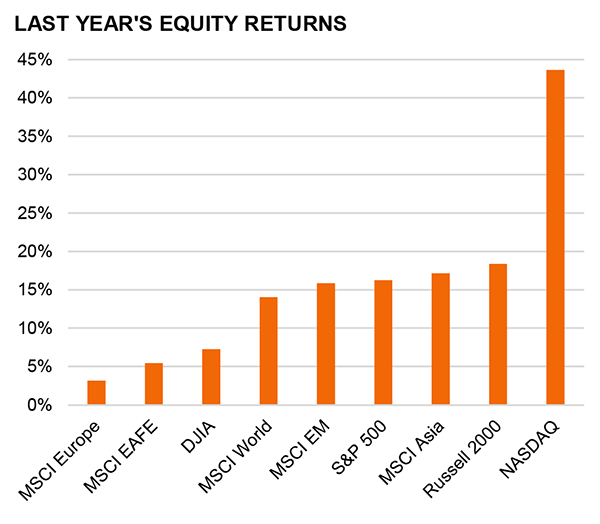
The MSCI Europe Index is a free float-adjusted market capitalization weighted index that is designed to measure the equity market performance of the developed markets in Europe. The MSCI EAFE Index (Europe, Australasia, Far East) is a free float-adjusted market capitalization index that is designed to measure the equity market performance of developed markets, excluding the US & Canada. The MSCI World Index is a free float-adjusted market capitalization weighted index that is designed to measure the equity market performance of developed markets. The MSCI Emerging Markets Index is a free float-adjusted market capitalization index that is designed to measure equity market performance of emerging markets. The MSCI AC (All Country) Asia ex Japan Index is a free float-adjusted market capitalization weighted index that is designed to measure the equity market performance of Asia, excluding Japan. The Dow Jones Industrial Average is a popular indicator of the stock market based on the average closing prices of 30 active U.S. stocks representative of the overall economy. S&P 500 Index is an unmanaged group of securities considered to be representative of the stock market in general. NASDAQ Composite Index measures all NASDAQ domestic and international based common type stocks listed on The NASDAQ Stock Market. The Russell 2000 Index measures the performance of the small-cap segment of the U.S. equity universe. It is not possible to invest directly in an index.
The opinions expressed in this commentary are those of the author and may not necessarily reflect those held by Kestra Investment Services, LLC or Kestra Advisory Services, LLC. This is for general information only and is not intended to provide specific investment advice or recommendations for any individual. It is suggested that you consult your financial professional, attorney, or tax advisor with regard to your individual situation.
Securities offered through Kestra Investment Services, LLC (Kestra IS), member FINRA/SIPC. Investment Advisory Services offered through Kestra Advisory Services, LLC (Kestra AS) an affiliate of Kestra IS. Kestra IS and Kestra AS are not affiliated with CD Wealth Management.