We wanted to take this occasion to look back at the content we’ve produced this year and share the 10 most widely read pieces of 2022 in case you missed any of them — or if you want to revisit and share them with friends and family.
Every week, we thoughtfully craft these letters with our clients in mind, broaching subjects we think are relevant and interesting. This is not syndicated content. We want you to find value in these letters — especially in times like these.
1. Before You Sell for a Loss, Make Sure You Know the Wash-Sale Rule
Investors may have seller’s remorse, but capturing losses to offset current taxes or future gains is a prudent strategy | May 5

When you sell an investment that has a loss in a taxable account, you may be eligible for a tax benefit. The wash-sale rule prevents investors from selling at a loss, then buying back the “substantially identical” investment within a 61-day window and being able to claim the tax benefit. This rule applies to stocks, bonds, mutual funds, exchange traded funds (ETFs) and options. Read more >
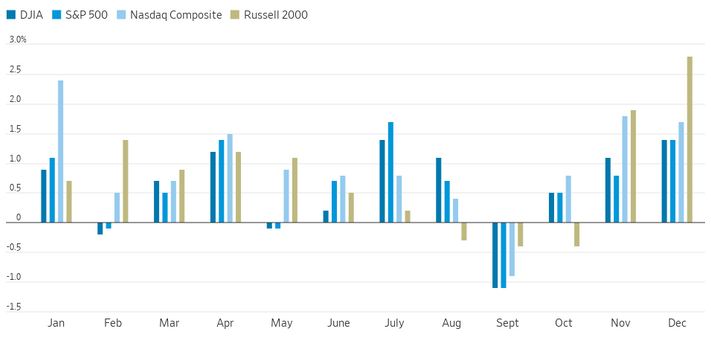
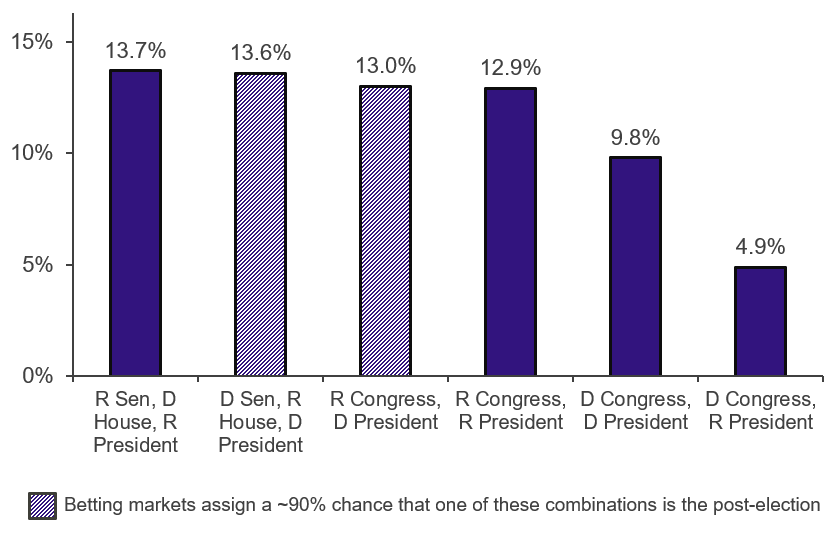
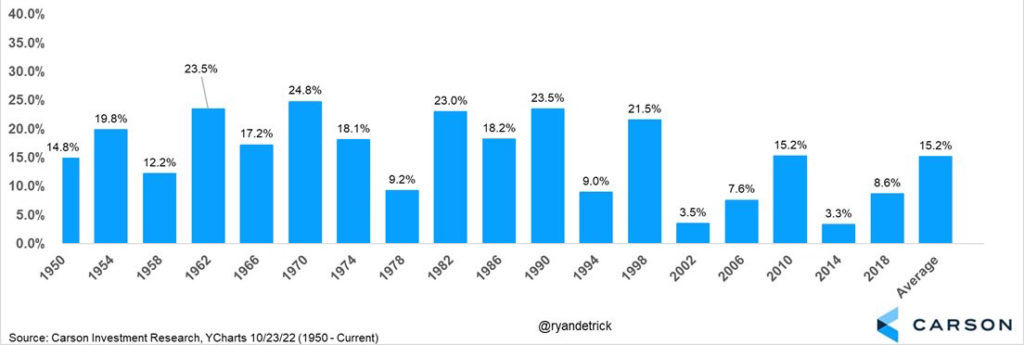
2. Midterm Elections are Right Around the Corner. What Does This Mean for the Market?
Midterm election years are historically more volatile than the rest of the presidential cycle | July 21

Depending on which party controls Congress, U.S. fiscal policy may change after the election. However, economic fundamentals — and not election results — play the greatest role in stock market performance. Read more >
3. Understanding the Importance of Market Liquidity
As the Fed injects less money into the economy to slow down inflation, liquidity is being reduced, which can lead to outsized market moves | Feb. 10

Over the last few years, liquidity has been a major driver in the stock market. In a liquid market — one that is not dominated by selling — the bid price and ask price are close to each other. As a market becomes more illiquid, such as during a sell-off like we saw last month, the spread between the bid and ask prices grows — meaning prices become less stable and transparent. Read more >
4. Here’s Why Today’s Housing Market Is Different from 2008
Home prices are rising, but the underlying drivers of the current market are different from the Great Financial Crisis | July 1

Lending has been in favor of those with much higher credit scores. Household balance sheets are in much better shape, and the percentage of one’s disposable income spent on mortgages is at an all-time low. Read more >
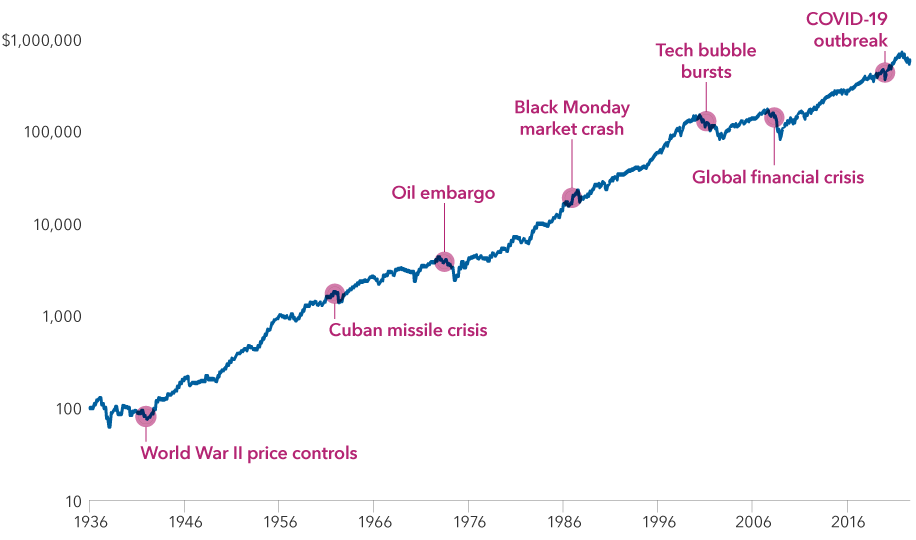
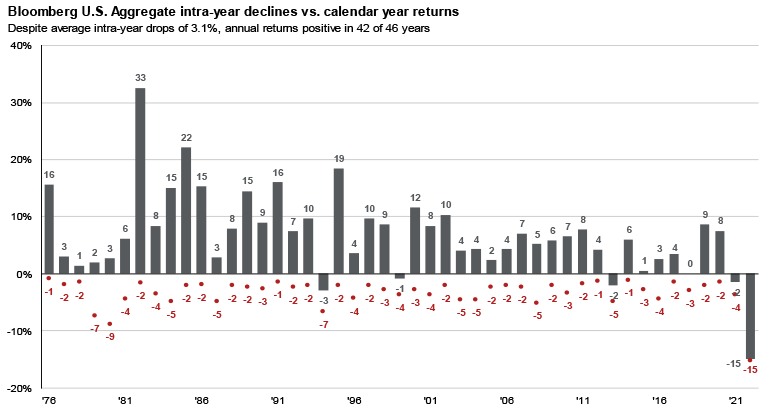
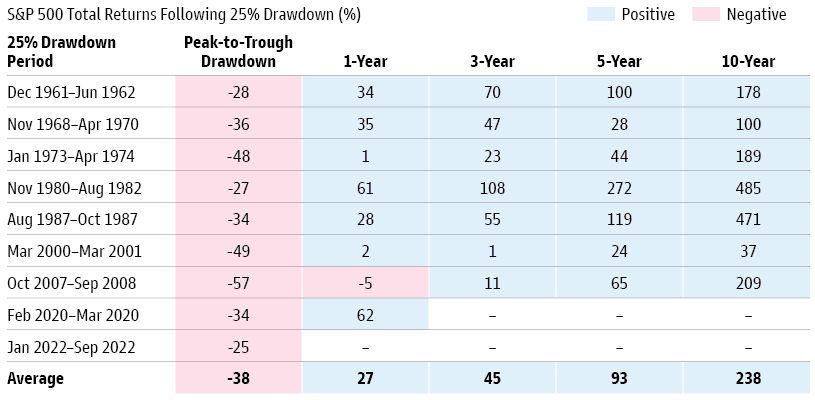
5. The Case for Staying Invested, Even When the Market Declines
The instinct to flee when the market starts to fall can have a major negative impact on the portfolio’s long-term health | Feb. 17

Investors who sit on the sidelines risk losing out on periods of market appreciation that follow the downturns. From 1929 through 2020, every decline of 15% or more in the S&P 500 has been followed by a strong recovery. Read more >
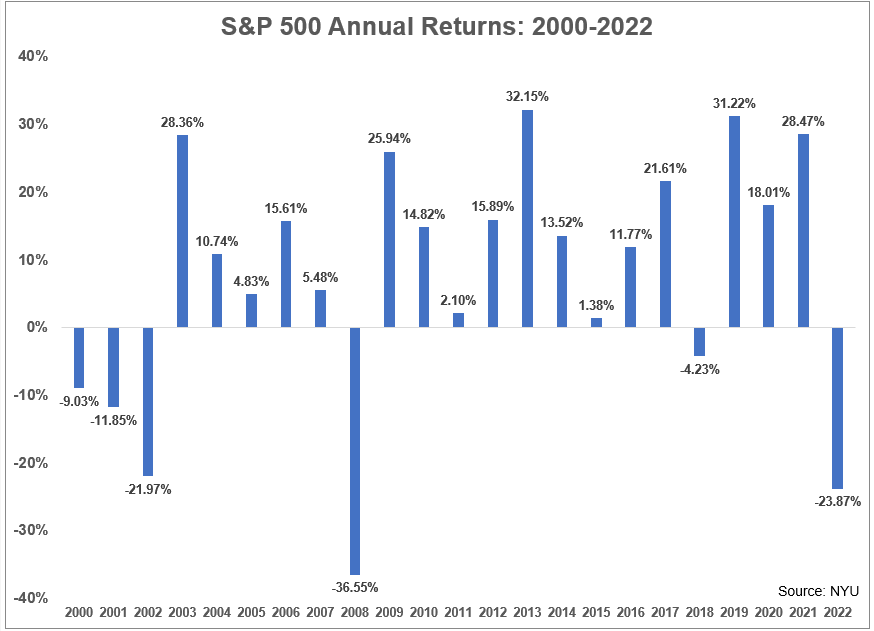
6. Don’t Let the Word ‘Recession’ Scare You: Here’s What History Has to Say
Recessions are normal occurrences in the economic cycle. In fact, we’ve already had three this century. Here’s what you should know | June 10

Just because the U.S. economy may have a recession does not mean it will be 2008 all over again and the stock market will experience similar pain. The stock market is a leading economic indicator, but most often it has already started to recover by the time the economy is officially in recession. Read more >
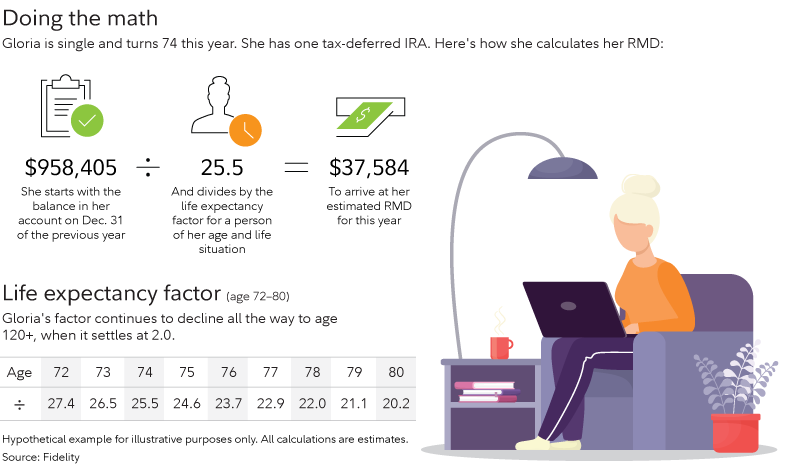
7. You’ve Inherited an IRA. What Happens Next?
The SECURE Act effectively ended the Stretch IRA, but it did not eliminate the need for financial planning when it comes to distributions | April 14

Under current law, you have 10 years to deplete the entire value of the IRA. However, if you wait until the 10th year to take the entire distribution and the IRA has experienced significant growth, you may be in the highest tax bracket, having to pay almost 40% in taxes for that one year. Read more >
8. What You Need to Know About Web 3.0 and the Metaverse
Social attitudes and norms are changing and adapting to the new era of the internet | Jan. 20

It will take many years for the metaverse to be fully formed and for the experiences to become part of the daily world. However, it appears the train has left the station, with social media and video game companies leveraging their large user bases to build the foundation of the metaverse. Read more >
9. What Does a Stronger U.S. Dollar Mean for You?
For the first time in nearly two decades, the exchange rate between the euro and the dollar is roughly the same | July 14

The parity in the two currencies comes after the euro has plunged almost 20% in value over the last 14 months compared to the dollar. This year, the U.S. dollar has gained against most major currencies, as the Fed’s interest rate hikes have made the dollar a safe haven for investors worldwide who are seeking protection against surging global inflation. Read more >
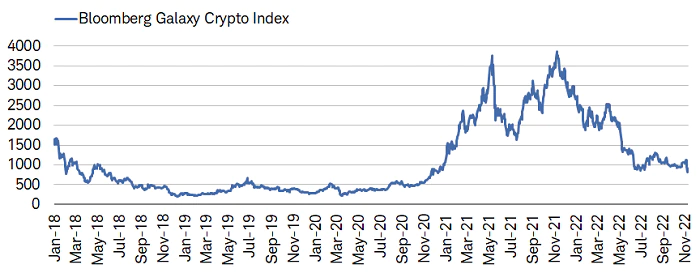
10. An Introduction to NFTs: What You Should Know About Digital Art
Like any collectible, an NFT’s value is based entirely on what someone else is willing to pay for it | Feb. 24

There are tens of thousands of NFTs in existence, representing a variety of topics, such as music, art and sports. Like any piece of art, beauty is in the eye of the beholder. Read more >
The CD Wealth Formula
We help our clients reach and maintain financial stability by following a specific plan, catered to each client.
Our focus remains on long-term investing with a strategic allocation while maintaining a tactical approach. Our decisions to make changes are calculated and well thought out, looking at where we see the economy is heading. We are not guessing or market timing. We are anticipating and moving to those areas of strength in the economy — and in the stock market.
We will continue to focus on the fact that what really matters right now is time in the market, not out of the market. That means staying the course and continuing to invest, even when the markets dip, to take advantage of potential market upturns. We continue to adhere to the tried-and-true disciplines of diversification, periodic rebalancing and looking forward, while not making investment decisions based on where we have been.
It is important to focus on the long-term goal, not on one specific data point or indicator. Long-term fundamentals are what matter. In markets and moments like these, it is essential to stick to the financial plan. Investing is about following a disciplined process over time.

This material contains an assessment of the market and economic environment at a specific point in time and is not intended to be a forecast of future events, or a guarantee of future results. Forward-looking statements are subject to certain risks and uncertainties. Actual results, performance, or achievements may differ materially from those expressed or implied. Information is based on data gathered from what we believe are reliable sources.
Using diversification as part of your investment strategy neither assures nor guarantees better performance and cannot protect against loss of principal due to changing market conditions.
Past performance is not a guarantee of future results.
The opinions expressed in this commentary are those of the author and may not necessarily reflect those held by Kestra Investment Services, LLC or Kestra Advisory Services, LLC. This is for general information only and is not intended to provide specific investment advice or recommendations for any individual. It is suggested that you consult your financial professional, attorney, or tax advisor with regard to your individual situation.
Securities offered through Kestra Investment Services, LLC (Kestra IS), member FINRA/SIPC. Investment Advisory Services offered through Kestra Advisory Services, LLC (Kestra AS) an affiliate of Kestra IS. CD Wealth Management and Bluespring Wealth Partners LLC* are affiliates of Kestra IS and Kestra AS. Investor Disclosures: https://bit.ly/KF-Disclosures
*Bluespring Wealth Partners, LLC acquires and supports high quality investment adviser and wealth management companies throughout the United States.