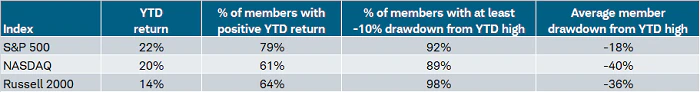
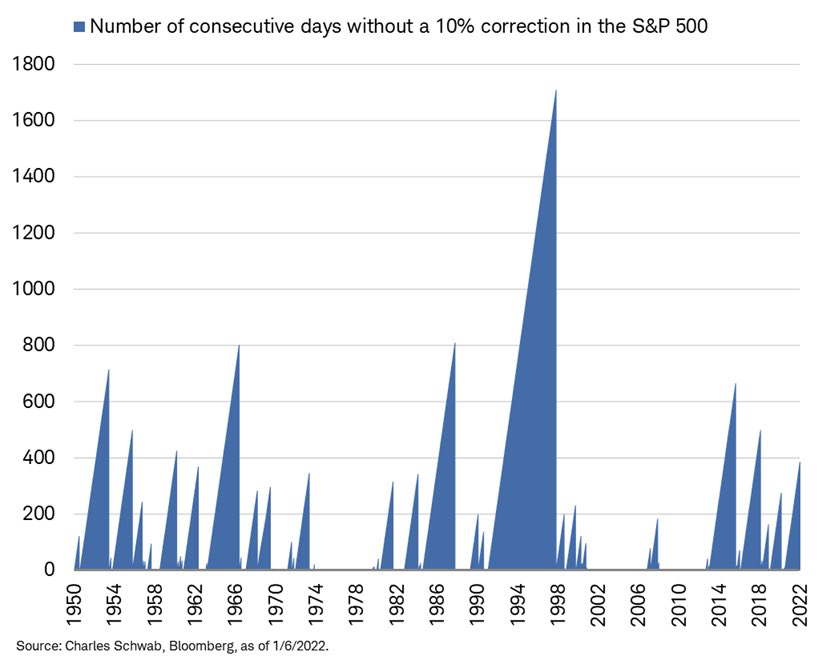
On Monday, we experienced a brief correction in the NASDAQ, with the index dropping more than 10% from its recent all-time high. Meanwhile, the S&P 500 index nears more than 400 days without a 10% pullback. Why the discrepancy? Big-cap technology stocks, which play a large role in both the S&P 500 and the NASDAQ, have held up much better in the recent selloff. Growth-oriented companies that have little to no earnings and higher valuations are being sold more rapidly.
The thought behind that move is that with the Federal Reserve beginning to raise rates this year, stocks with higher multiples and lower earnings have higher valuations, and therefore are more negatively affected. The reason for this is that the higher the interest rate used to discount future cash flows, the lower the future earnings are worth as those earnings are being divided by a higher number. As rates fall, the opposite is true, and companies with those same higher growth multiples become more valuable into the future.
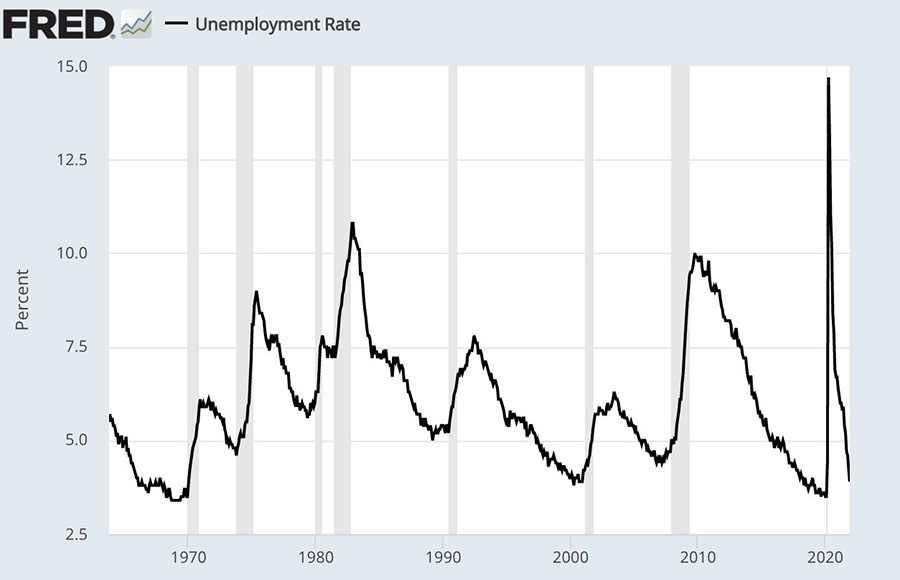
In November, more than 4.5 million people quit or changed their jobs. At the same time, there were more than 10.6 million job openings, which was down from 11.1 million in October but still a high number by historical standards. The unemployment rate has dropped to 3.9% from 4.2% as reported last week. This number is now closing in on the pre-pandemic low unemployment rate of 3.5%, as seen in the chart below. Why is this happening? COVID-19 burnout and fear are continuing, but many people also have confidence to quit their jobs because of the high number of job openings and rising pay. Wage growth remains strong and is expected to remain that way in 2022.
Anyone who quits a job will need to decide what to do with 401(k) savings in their former employer’s retirement plan. As part of the financial planning process, we conduct ongoing reviews and discuss each client’s current 401(k) plans. We discuss what is in their best interest — not only when they are working and investing in the plan but also at retirement or when they leave their job. When you leave a job, you have four options regarding your 401(k):
• Rollover to an IRA. An IRA will offer more freedom to invest funds as you wish, since 401(k)s typically have limited offerings. In an IRA, one can purchase exchange traded funds (ETFs), individual stocks, mutual funds, individual bonds and other sector-specific holdings. IRAs may come with additional fees for the management and oversight of those assets.
• Leave the money where it is. This assumes that the former employer will allow you to keep the money in the 401(k) plan (not all businesses do). If you leave the money in your old company’s 401(k) plan, you may not be able to borrow against it. Also, if there are not many investment choices offered in the plan, you might be better off transferring to another tax-advantaged retirement plan. Often, investors tend to forget about their past 401(k) plans if they do not roll them into an IRA or new 401(k), and no ongoing portfolio management happens — to their detriment.
• Roll it into the new employer’s 401(k). Not all plans allow for this option. This decision may depend on the investment options provided by the new plan, as well as the cost. This method is preferable to leaving the money with the former company’s 401(k) plan, however, because the money will then be consolidated (and not forgotten).
• Cash out the 401(k). This is the worst of the four options because any monies that are taken out of the 401(k) are counted as ordinary income and can potentially cause one to be in a higher tax bracket. This also may be detrimental to the long-term financial plan.
As part of our fiduciary responsibility and oversight — as well as our financial-planning process — we discuss all these options with our clients when they are leaving a job. We want to ensure that we are making decisions in our client’s best interests and walking them through all their options.
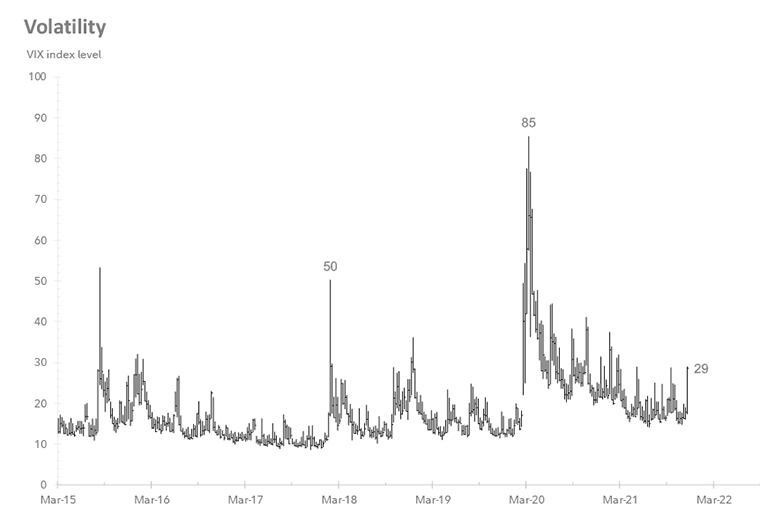
So, what can we learn from all this? We expect increased volatility in 2022 as the Federal Reserve Bank figures out its strategy to combat inflation. There has not been a 10% correction in the S&P 500 in almost 400 days, but when a correction does occur, we will continue to stay the course and provide the same level of guidance we always do.
From a portfolio perspective, we continue to adhere to the tried-and-true disciplines of diversification, periodic rebalancing and looking forward, while not making investment decisions based on where we have been. Making market decisions based on what might happen may be detrimental to long-term performance. The key is to stay invested and stick with the financial plan. Markets go up and down over time, and downturns present opportunities to purchase stocks at a lower value. As we say each week, it is important to stay the course and focus on the long-term goal, not on one specific data point or indicator.
It all starts with a solid financial plan for the long run that understands the level of risk that is acceptable for each client. Regarding investments, we believe in diversification and in having different asset classes that allow you to stay invested. The best option is to stick with a broadly diversified portfolio that can help you to achieve your own specific financial goals — regardless of market volatility. Long-term fundamentals are what matter.
Sources: Schwab, Federal Reserve Bank

This material contains an assessment of the market and economic environment at a specific point in time and is not intended to be a forecast of future events, or a guarantee of future results. Forward-looking statements are subject to certain risks and uncertainties. Actual results, performance, or achievements may differ materially from those expressed or implied. Information is based on data gathered from what we believe are reliable sources.
Using diversification as part of your investment strategy neither assures nor guarantees better performance and cannot protect against loss of principal due to changing market conditions.
Past performance is not a guarantee of future results.
The opinions expressed in this commentary are those of the author and may not necessarily reflect those held by Kestra Investment Services, LLC or Kestra Advisory Services, LLC. This is for general information only and is not intended to provide specific investment advice or recommendations for any individual. It is suggested that you consult your financial professional, attorney, or tax advisor with regard to your individual situation.
Securities offered through Kestra Investment Services, LLC (Kestra IS), member FINRA/SIPC. Investment Advisory Services offered through Kestra Advisory Services, LLC (Kestra AS) an affiliate of Kestra IS. Kestra IS and Kestra AS are not affiliated with CD Wealth Management. Investor Disclosures: https://bit.ly/KF-Disclosures