2020 portfolio recap and trends for 2021

As we near the end of 2020, we look back on the stock market’s wild ride. The year began with positive equity returns, followed by a global pandemic that sent the market into a drop not seen since the Great Recession and then a strong recovery, led by technology stocks from the “stay at home economy.”  Throughout the year, we made the following changes to our risk managed portfolios: 

1. In early February, we significantly reduced energy exposure, and in late March, we increased large-cap exposure, through additional exposure to technology and healthcare. We funded the changes by selling out of small- and mid-cap stocks, as well as real estate. We anticipated that small- and mid-cap stocks would take longer to recover from the economic shock caused by COVID, while technology and healthcare would benefit from the stay-at-home economy. At the same time, for fixed income, we sold emerging market debt and added to our U.S. bond portfolio through additional exposure to high-quality corporate bonds.

2. We have continued throughout the year to be active and nimble in this market, and in May, we reduced our exposure to higher-dividend stocks. We used the proceeds from the sale to increase our exposure to healthcare in the portfolio. 

3. In July, we removed the remaining higher dividend-yielding exposure. We moved the monies into equities that instead focus on dividend appreciation. The index tracks the performance of stocks of companies with a record of growing their dividends year over year. 

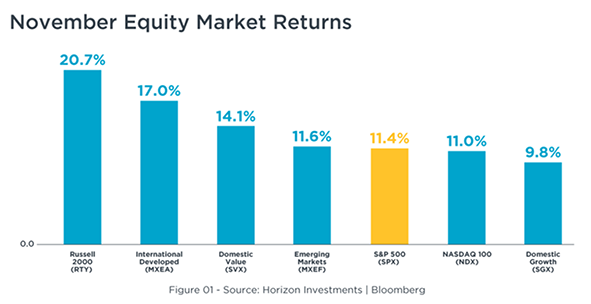
4. In November, upon the announcement of a vaccine being available, we decided to add back small- and mid-cap growth stocks that would benefit from the reopening of the economy, and we swapped out of our position in global infrastructure.

Our focus remains on long-term investing with strategic allocation while maintaining a tactical approach. Our decisions to make changes are calculated and well thought-out, looking at where we see the economy moving. To use a hockey analogy from Hall of Famer Wayne Gretzky, we skate to where the puck is going, not to where it already has been. We are not guessing or timing the market. We are anticipating and moving to those areas of strength.  

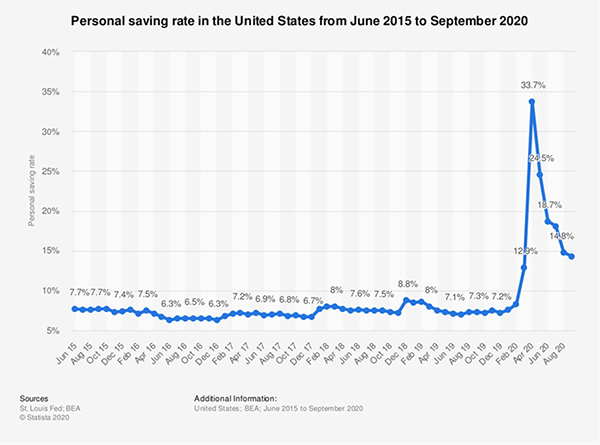
We strategically have new cash on the sidelines and buy in for those clients on down days or dips in the market, similar to what people do in their 401(k)s every other week. We speak with our clients regularly about staying the course and not listening to the economic noise, as we feel the markets will come back over time. 

Looking into 2021 and beyond, we see the following trends:

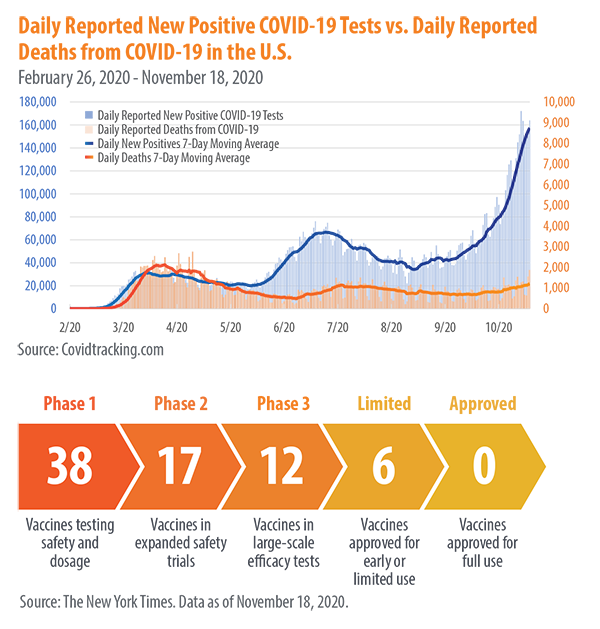
* In the short term, the outlook for the global economy hinges on health outcomes, specifically when the vaccine will roll out and how long it will take before economies return to their pre-pandemic levels. Social activities have been curtailed, and job losses in service sectors have been scarring, but the permanent job losses are likely to be limited.

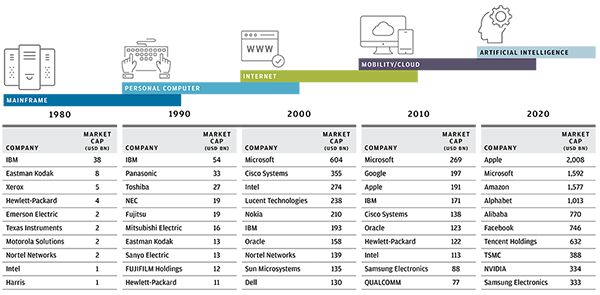
* Work automation and digital technologies have been accelerated by COVID-19. People are relocating from the cities to the suburbs as more people work from home, and this is likely to continue in the post-pandemic world.

* The crisis responses by the government and Federal Reserve have been faster and more direct, and they are unlikely to be reversed quickly. For example, interest rates are projected to remain close to zero for years to come, whereas in the past, the Fed would be quicker to raise short-term rates as the economy ramps up.

So, what can we learn from all this?  From an investment perspective, we use these trends to help with the strategic and tactical asset allocation and where we see the portfolio heading over the next five to seven years, with short-term adjustments along the way. We are not trying to time the market, but we will try to take advantage when we see where the puck is going. As we near the end of 2020, we view more risk in being out of the market than in being in the market. Our plan is to ride out future market volatility, have a diversified portfolio and stay the course. 

It all starts with a solid financial plan for the long run that understands the level of risk that is acceptable for each client. With regards to investments, we believe in diversification and having different asset classes that allow you to stay invested. The best option is to stick with a broadly diversified portfolio that can help you to achieve your own specific financial goals – regardless of market volatility.  Long-term fundamentals are what matter.

_____

This material contains an assessment of the market and economic environment at a specific point in time and is not intended to be a forecast of future events, or a guarantee of future results.  Forward-looking statements are subject to certain risks and uncertainties.  Actual results, performance, or achievements may differ materially from those expressed or implied.  Information is based on data gathered from what we believe are reliable sources.

Using diversification as part of your investment strategy neither assures nor guarantees better performance and cannot protect against loss of principal due to changing market conditions.

The opinions expressed in this commentary are those of the author and may not necessarily reflect those held by Kestra Investment Services, LLC or Kestra Advisory Services, LLC.  This is for general information only and is not intended to provide specific investment advice or recommendations for any individual.  It is suggested that you consult your financial professional, attorney, or tax advisor with regard to your individual situation.  

Securities offered through Kestra Investment Services, LLC (Kestra IS), member FINRA/SIPC. Investment Advisory Services offered through Kestra Advisory Services, LLC (Kestra AS) an affiliate of Kestra IS. Kestra IS and Kestra AS are not affiliated with CD Wealth Management. 

Going up: Online shopping, consumer saving and the markets

Preliminary sales numbers have been posted for Thanksgiving and Black Friday, and they paint an interesting picture. Black Friday hit a new record with consumers spending an estimated $9 billion, an increase of 21.6% over last year’s $7.4 billion. On Thanksgiving Day, retail sales totaled $5.1 billion, an increase of 21.5% over last year. 

Meanwhile, foot traffic at stores fell by 52.1% compared with last year, a reflection of consumers’ move toward online shopping as the pandemic continues to spread. And consumers have more money to spend as well; consumer saving remains elevated compared to pre-pandemic levels. The stock market is reflecting optimism in companies that heavily favor the online retail environment, even in a post-pandemic reality.

The stock market continued to move higher in November, setting records along the way. The chart below reflects November equity market returns for stock indexes through Nov. 27. The Dow Jones Index breached 30,000 for the first time, and the NASDAQ surged past 12,000. Investors are in a bullish mood while the economy continues to deal with the second wave of the coronavirus, possible lockdowns, increased unemployment claims and a lack of stimulus from Congress for those who remain out of work. While economic numbers and sometimes grim headlines tell the story of the past, the stock market’s focus on is on the future. The markets aren’t ignoring the news of the day, they simply are looking beyond it.

Past performance is no guarantee of future results.

Optimism in stocks continues to move the market higher, shrugging off negative economic data. The reason for the optimism is severalfold:

    • Expected vaccine rollouts from Pfizer and Moderna later this year and in early 2021
    • Political winds calming with the change in administration
    • Potential split party between the White House and the Senate
    • Continued talk of stimulus package before the end of the year
    • Federal Reserve’s pledge to keep rates near zero for years to come

This does not mean that stocks are without risks. It will be some time before industries such as hospitality, service and energy return to their pre-COVID levels of employment and positive outlook. Stock prices are high based on optimism for the future, which is reflecting breakthroughs in vaccine development. However, the backdrop remains positive for asset prices, and we will continue to buy the market dips.

So, what can we learn from all this?  

Trying to time the market is extremely difficult. As we near the end of 2020, we view more risk being out of the market than in the market. Riding out future market volatility in addition to having a diversified portfolio means staying the course. 

It all starts with a solid financial plan for the long run that understands the level of risk that is acceptable for each client. With regards to investments, we believe in diversification and having different asset classes that allow you to stay invested. The best option is to stick with a broadly diversified portfolio that can help you to achieve your own specific financial goals – regardless of market volatility. Long-term fundamentals are what matter.

Data Sources: Horizon, St. Louis Federal Reserve, CNBC

_____

This material contains an assessment of the market and economic environment at a specific point in time and is not intended to be a forecast of future events, or a guarantee of future results.  Forward-looking statements are subject to certain risks and uncertainties.  Actual results, performance, or achievements may differ materially from those expressed or implied.  Information is based on data gathered from what we believe are reliable sources.

S&P 500 Index is an unmanaged group of securities considered to be representative of the stock market in general.  The Dow Jones Industrial Average is a popular indicator of the stock market based on the average closing prices of 30 active U.S. stocks representative of the overall economy. NASDAQ Composite Index measures all NASDAQ domestic and international based common type stocks listed on The NASDAQ Stock Market. The Russell 2000 Index (RTY) measures the performance of the small-cap segment of the U.S. equity universe. The MSCI EAFE Index (MXEA) is an equity index which captures large and mid cap representation across 21 Developed Markets countries around the world, excluding the US and Canada. The S&P 500® Value Index (SVX), represents the value companies, as determined by the index sponsor, of the S&P 500 Index. The Index measures the performance of large-capitalization value companies in the United States. The MSCI Emerging Markets Index (MXEF) captures large and mid cap representation across 26 Emerging Markets countries. The NASDAQ-100 Index (NDX) is made up of 103 equity securities issued by 100 of the largest non-financial companies listed on the Nasdaq stock market. It is a modified capitalization-weighted index. The S&P 500® Growth Index (SGX), represents the growth companies, as determined by the index sponsor, of the S&P 500 Index. The Index measures the performance of large-capitalization growth companies in the United States. It is not possible to invest directly in an index.

The opinions expressed in this commentary are those of the author and may not necessarily reflect those held by Kestra Investment Services, LLC or Kestra Advisory Services, LLC.  This is for general information only and is not intended to provide specific investment advice or recommendations for any individual.  It is suggested that you consult your financial professional, attorney, or tax advisor with regard to your individual situation.  

Securities offered through Kestra Investment Services, LLC (Kestra IS), member FINRA/SIPC. Investment Advisory Services offered through Kestra Advisory Services, LLC (Kestra AS) an affiliate of Kestra IS. Kestra IS and Kestra AS are not affiliated with CD Wealth Management. 

4 of the trends we are watching

In this week’s update, we want to share with you our thoughts on the broader market and what we see on the horizon as we approach 2021.

1. Vaccine: Three drug companies have signaled that their vaccines show greater than 90% efficacy, which is extremely strong; a typical flu vaccine is roughly 40% to 50% effective in a given year. Around the world, 12 vaccines are in phase III trials, and as vaccines begin to roll out soon, delivery and distribution will become the focal point. The markets have responded in anticipation of a “return to normal” in 2021 as speculators sell the work-from-home stocks, looking for value in beat-up sectors such as energy and financials. 

We think that this is premature, as interest rates are likely to remain low for several years and energy companies must work through their excess supply while demand remains well below normal levels. Also, the virus is spreading rapidly throughout the country, and several cities and states are imposing a modified version of a lockdown to prevent their hospitals from becoming overrun.

2. Staying the course: Just as they did four years ago, the pollsters on TV misread the election. The lesson: Not only is politics unpredictable, but our certainties about investing might be wrong as well. We tend to overestimate the prevalence of negative information, which can lead to bad decisions. As we write in our weekly updates, it’s important to stay the course, follow the financial plan and to avoid trying to time the market based on what we think are certain outcomes. A recent Wall Street Journal article sums it well: “The trick is to embrace uncertainty without fooling yourself into thinking that impetuous decisions can give you control over it.”1 

3. Technology (and talk of a bubble): Led by the so-called FAANG stocks – Facebook, Amazon, Apple, Netflix and Google — the technology sector has performed very well in 2020 compared to the overall market. Several factors have helped technology stocks outperform this year:

* Ease of buying and selling through new trading apps that allow fractional share ownership.

* Cheap money through low interest rates.

* Speculation of stay-at-home companies like Zoom — and how they will permanently change how business will be performed.

If you equally weight all the stocks in the S&P 500 instead of looking at it from a market-weighted perspective, the overall market is roughly 10% above its long-term average. Or, as the Wall Street Journal put it: “A Stock Market Bubble? It’s More Like a Fire.”

4. The evolution of industry: Over the last four decades, waves of innovation have transformed the power of technology, creating a new batch of winners across sectors and industries. As technology evolves, the sector lines continue to blur. For example, companies are now classified as FinTech, a combination of a financial and technology company. Healthcare companies’ use of artificial intelligence enables more efficient drug discovery. As we look ahead, we think that the disruptive power of technology will continue to spur shifts within industries and pave the way for new market leadership.

Source: Bloomberg. Market Matrix U.S. Sell 5 Year & Buy 30 Year Bond Yield Spread (USYC5Y30 Index). Daily data as of 10/12/2020.

So, what can we continue to learn from all this?  

Accurately predicting the next market move and timing the market is extremely difficult and can adversely affect the long-term performance of your portfolio. Riding out future market volatility in addition to having a diversified portfolio means staying the course and not trying to time the market. It all starts with a solid financial plan for the long run that understands the level of risk that is acceptable for each client. With regards to investments, we believe in diversification and having different asset classes that allow you to stay invested. The best option is to stick with a broadly diversified portfolio that can help you to achieve your own specific financial goals – regardless of market volatility. The economy, and therefore, the market, is bigger than the direction the political winds are blowing. Ultimately, it’s the long-term fundamentals that matter.

_____

All investments involve risk, including loss of principal. Past performance does not guarantee future results. There is no assurance that the investment process will consistently lead to successful investing. Asset allocation and diversification do not eliminate the risk of experiencing investment losses. Mutual funds are subject to market, exchange rate, political, credit, interest rate and prepayment risks, which vary depending on the type of mutual fund. Information provided is provided solely for informational purposes and therefore are not an offer to buy or sell a security, and are not warranted to be correct, complete or accurate by Kestra IS or Kestra AS.

This material contains an assessment of the market and economic environment at a specific point in time and is not intended to be a forecast of future events, or a guarantee of future results.  Forward-looking statements are subject to certain risks and uncertainties.  Actual results, performance, or achievements may differ materially from those expressed or implied.  Information is based on data gathered from what we believe are reliable sources.

S&P 500 Index is an unmanaged group of securities considered to be representative of the stock market in general.  You cannot directly invest in the index.
The opinions expressed in this commentary are those of the author and may not necessarily reflect those held by Kestra Investment Services, LLC or Kestra Advisory Services, LLC.  This is for general information only and is not intended to provide specific investment advice or recommendations for any individual.  It is suggested that you consult your financial professional, attorney, or tax advisor with regard to your individual situation. 
 
Securities offered through Kestra Investment Services, LLC (Kestra IS), member FINRA/SIPC. Investment Advisory Services offered through Kestra Advisory Services, LLC (Kestra AS) an affiliate of Kestra IS. Kestra IS and Kestra AS are not affiliated with CD Wealth Management.

Click here for additional investor disclosures.

The election is over. Now what?

Although some recounts and legal action remain before the results of the election become official, news networks have projected that Joe Biden will be the nation’s 46th president — and markets have rallied over the past week, buoyed by additional clarity and less policy uncertainty.

The S&P 500 rose 7.3% for the week last week. The strength continued this week with news from Pfizer on its vaccine efficacy and the hope that the world can return to “normal” in 2021. The predicted “blue wave” that some investors feared would unify the government and lead to significant policy shifts has evaporated — although legislative control remains up for grabs with a pair of Senate runoffs in Georgia coming in January. The chart below shows that since 1945, the S&P 500 has averaged a 14% annualized return with a divided Congress and a 12% return with a unified government. 

We received many calls leading up to the election from investors who were concerned about the possibility of higher volatility and a major market selloff after the election. As is often the case, however, the opposite occurred: We have seen volatility drop to levels last seen in August, and even before that, pre-pandemic levels. The chart below illustrates that volatility and market returns often move counter to each other. When volatility goes down, the stock market sees higher returns, and when volatility increases, stock market returns decrease.    

As we have discussed before, trying to time the market and make large bets seldom works out favorably. Market timing is rarely a winning strategy; staying invested is the key to long-term success. Historically, the best financial approach in election years is to stay invested, and we saw this play out again last week. Sticking with a long-term financial plan that is based on individual objectives while avoiding market timing around politics is usually the best course of action.

So, what can we learn from all this? 

Accurately predicting the next market move and timing the market is extremely difficult and can adversely affect the long-term performance of your portfolio. Riding out future market volatility in addition to having a diversified portfolio is sound strategy. It all starts with a solid financial plan for the long run that is based on your acceptable level of risk. The best option is to stick with a broadly diversified portfolio that can help you to achieve your own goals, regardless of market volatility. The economy, and therefore, the market, is bigger than the direction the political winds are blowing. Ultimately, it’s the long-term fundamentals that matter.

Data sources: GSAM, Index Indicators, Capital Group

_____

This material contains an assessment of the market and economic environment at a specific point in time and is not intended to be a forecast of future events, or a guarantee of future results.  Forward-looking statements are subject to certain risks and uncertainties.  Actual results, performance, or achievements may differ materially from those expressed or implied.  Information is based on data gathered from what we believe are reliable sources.

S&P 500 Index is an unmanaged group of securities considered to be representative of the stock market in general.  You cannot directly invest in the index.The opinions expressed in this commentary are those of the author and may not necessarily reflect those held by Kestra Investment Services, LLC or Kestra Advisory Services, LLC.  This is for general information only and is not intended to provide specific investment advice or recommendations for any individual.  It is suggested that you consult your financial professional, attorney, or tax advisor with regard to your individual situation. 
 
Securities offered through Kestra Investment Services, LLC (Kestra IS), member FINRA/SIPC. Investment Advisory Services offered through Kestra Advisory Services, LLC (Kestra AS) an affiliate of Kestra IS. Kestra IS and Kestra AS are not affiliated with CD Wealth Management.

Click here for additional investor disclosures.

Profits, Profits, Profits

On the heels of a record decrease in gross domestic product (GDP) for the second quarter, the U.S. economy rebounded swiftly with a record increase in the third quarter. GDP — the amount spent by U.S. consumers during a given period — climbed 33.1% from July through September after taking a 31.4% tumble from April through June.

While pent-up demand for consumer goods and better manufacturing activity drove that growth, the U.S. economy remains about 4% lower than last year’s levels, and service sectors such as hospitality, restaurants and airlines remain under pressure.

As the economy rebounded in the third quarter, so too did profits. So far, almost 72% of the companies in the S&P 500 have reported earnings for the third quarter. Of those, 87% exceeded earnings estimates, and 77% beat revenue estimates, well above long-term averages. 

It is possible that analysts set the bar too low for the third quarter, though, as sectors such as energy and financials are seeing positive earnings surprises despite being lower than a year ago. The chart below shows that each sector in the S&P 500 had better than expected earnings for the third quarter.

Although the economy is recovering from the shutdown in March and April, the road to recovery continues to be challenging. Consumer staples, technology and health care are expected to see positive earnings growth on a year-over-year basis. Other sectors, like financials and energy, are expected to decline year over year. However, as the chart above illustrates, banks and energy companies have reported stronger revenues and earnings than anticipated. 

Bank profits have been better than expected with strong trading revenues from asset management as well as lower-than-expected loan-loss provisions. As the chart below shows, current losses stand at 8.3% of sales for banks, compared to 19.7% of sales in aftermath of the Global Financial Crisis. Even with rates at or near zero, the financial companies are able to limit their loan losses and therefore, deliver positive earnings to the bottom line.

With 2020 earnings generally better than expected and earnings season more than two-thirds complete, where do we go from here?  Although the current environment feels more uncertain than normal with the election as well as the COVID-19 pandemic, the best approach to investing in the markets remains one of balance and maintaining asset allocation that meets your individual risk tolerance. As we have written several times over the last few months, the markets do not care about election results; they favor certainty and profits. Historically, markets have performed very similarly regardless of which party controls the White House.

What does this mean for you? 

Having a mix of growth and value stocks, large stocks and small stocks, U.S. stocks and international stocks and bonds while staying the course has always made the most sense for investors. 

Remember that market downturns offer the chance to buy stocks at lower prices, which could position a portfolio well for future growth. If we experience volatility due to election turmoil, we will follow your financial plan and ignore the noise. There are no guarantees that stocks will perform to anyone’s expectations, and decisions could result in losses including a possible loss in principal. However, it may be helpful to remember that some investors use downturns as opportunities to buy stocks that were previously overvalued relative to their perceived earnings potential.

Data Sources: FactSet, JP Morgan Asset Management, Invesco

_____

This material contains an assessment of the market and economic environment at a specific point in time and is not intended to be a forecast of future events, or a guarantee of future results.  Forward-looking statements are subject to certain risks and uncertainties.  Actual results, performance, or achievements may differ materially from those expressed or implied.  Information is based on data gathered from what we believe are reliable sources.

S&P 500 Index is an unmanaged group of securities considered to be representative of the stock market in general.  You cannot directly invest in the index.The opinions expressed in this commentary are those of the author and may not necessarily reflect those held by Kestra Investment Services, LLC or Kestra Advisory Services, LLC.  This is for general information only and is not intended to provide specific investment advice or recommendations for any individual.  It is suggested that you consult your financial professional, attorney, or tax advisor with regard to your individual situation. 
 
Securities offered through Kestra Investment Services, LLC (Kestra IS), member FINRA/SIPC. Investment Advisory Services offered through Kestra Advisory Services, LLC (Kestra AS) an affiliate of Kestra IS. Kestra IS and Kestra AS are not affiliated with CD Wealth Management.

Click here for additional investor disclosures.

Presidents and portfolios

We are now a few days from the election, and we are receiving calls and emails from clients who are wondering if they should make changes to their portfolios before the results come in. History suggests election results should not be the primary driver of investment decisions; this is especially true this year, with the pandemic and the fiscal and monetary response from the Federal Reserve driving the markets. While the election certainly will have an impact on the country, we caution against taking drastic action in the world of investing.

Market commentators — and presidents themselves — have cited the stock market’s performance as a measuring stick of White House policies, but the data doesn’t support this, as seen in the chart below.

Instead, the key drivers of stock market performance are the fundamentals of earnings, interest rates, job growth and productivity. Policy changes do have ramifications for financial plans, tax strategy and estate planning, but not when it comes to day-in, day-out asset allocation.

We want you to keep these thoughts in mind as we enter the home stretch of the election:

1. Markets have performed well under both parties. As the light blue bars show in the chart below, the markets have yielded positive returns, no matter which party controls the White House or Congress, over a four-year presidential cycle. 

2. Investors are better off staying fully invested. The best-performing portfolio over the past 120 years was one that stayed fully invested through both Democratic and Republican administrations.

3. Monetary policy matters more than who occupies the White House. Historically, presidents have been hurt or helped by monetary policy conditions. Both President Reagan and President Clinton benefited from consistently falling interest rates. Both President George H.W. Bush and President George W. Bush were hurt by Fed tightening, an inverted yield curve and a recession. President Obama benefited from a benign rate environment during his term (minus a brief moment in 2015–2016), and President Trump experienced tighter policy during his first two years, but the last two years have seen rates return to zero. The adage “Don’t fight the Fed” rings true.

4. Don’t confuse politics with market analysis. Some of the best returns in the market came when the presidential approval rating was in the low range of between 36% and 50%.

What does this mean for you?

Investors have prospered in markets during difficult political times. The average return of the S&P 500 since the end of World War II is almost 11%. Staying the course has always made the most sense for investors. Follow your financial plan and ignore the noise.

Remember that market downturns offer the chance to buy stocks at lower prices, which could position a portfolio well for future growth. Again, there are no guarantees that stocks will perform to anyone’s expectations, and decisions could result in losses including a possible loss in principal. However, it may be helpful to remember that some investors use downturns as opportunities to buy stocks that were previously overvalued relative to their perceived earnings potential.

_____

This material contains an assessment of the market and economic environment at a specific point in time and is not intended to be a forecast of future events, or a guarantee of future results.  Forward-looking statements are subject to certain risks and uncertainties.  Actual results, performance, or achievements may differ materially from those expressed or implied.  Information is based on data gathered from what we believe are reliable sources.

S&P 500 Index is an unmanaged group of securities considered to be representative of the stock market in general.  You cannot directly invest in the index.
The opinions expressed in this commentary are those of the author and may not necessarily reflect those held by Kestra Investment Services, LLC or Kestra Advisory Services, LLC.  This is for general information only and is not intended to provide specific investment advice or recommendations for any individual.  It is suggested that you consult your financial professional, attorney, or tax advisor with regard to your individual situation. 
 
Securities offered through Kestra Investment Services, LLC (Kestra IS), member FINRA/SIPC. Investment Advisory Services offered through Kestra Advisory Services, LLC (Kestra AS) an affiliate of Kestra IS. Kestra IS and Kestra AS are not affiliated with CD Wealth Management.

Click here for additional investor disclosures.

Do deficits matter anymore?

Among the financial damage from the coronavirus pandemic has been the large increase in the federal budget. The pandemic has caused massive economic disruption, and the U.S. government deficit has soared, as COVID-related fiscal stimulus is still being required. 

However, Americans appear to be less concerned about the deficit than in recent years. A recent Pew study reflects that in June 2020, only 47% of Americans viewed the deficit as a large problem, compared with 55% just two years ago. In fact, clients often ask us, “What should we do about the growing deficit  — and with interest rates so low, do deficits really matter anymore?”

Federal Reserve policies, including low interest rates and quantitative easing (QE), have enabled the government to increase stimulus spending with little risk for now. With all of the challenges facing the economy, the Fed has allowed the government to issue new debt with interest rates at historically low levels. This is very similar to homeowners continually refinancing their home mortgages as rates continue moving lower. Often, homeowners will take equity out of their house when they refinance, increasing what they owe to the bank but lowering their overall payments since their new interest rate has decreased.

With interest rates having been on the decline for many years, and with the Fed’s recent statements pointing toward keeping them lower for years to come, servicing a higher deficit seems to cost relatively little. As seen in the chart below, the federal deficit has risen to almost 15% of GDP as fiscal stimulus was needed along with a plunge in GDP growth due to the economic shutdown. Congress is negotiating how much more stimulus will be needed to help businesses that are still affected by the global pandemic. 

But with rates low, servicing a higher deficit level costs much less. In 1996, interest payments accounted for 15.4% of total federal spending. In 2019, the federal government paid out $375 billion of interest on its debt, accounting for 8.4% of total federal spending.

The bigger question remains with state and local government deficits, which have increased as well during the crisis. Tax revenues have decreased and unemployment insurance costs have risen as the unemployment rate currently sits at 7.9%. City and state spending have accounted for more of GDP spending than the federal government; local governments employ more workers than the federal government.  

However, state and local governments must balance their operating budgets every year and can’t borrow to finance large deficits. To date, federal aid has exceeded projected revenue losses, but unless the federal government continues to support local economies, projected shortfalls are forecasted for years to come. If aid to the states and local governments is not in the upcoming stimulus package, states will cut back their spending and in turn will restrain the vigor of economic recovery.  

Tax policy in the next four years remains uncertain with the looming election. Regardless of who occupies the White House, state and local taxes could rise in the coming years to fill the budget shortfalls created by the pandemic. These shortfalls could hinder economic recovery in the near term, just as after the great recession of 2007-2009, local governments’ spending didn’t support their economies for five years after the recession.   

Today’s borrowing is largely appropriate and necessary in order to reduce the economic pain caused by the COVID-19 pandemic. Once the pandemic ends and the economy is on its way to recovery, policymakers will turn their focus to long-term debt and deficit reduction to get the country on solid fiscal ground. Even as the level of debts rise, the cost of carrying the debt, reflected with low interest rates, has tumbled. Financial markets have maintained confidence in the ability for the U.S. to carry the financial burdens. As The New York Times put it, “The economy has not drowned in the flood of red ink – and there’s a growing sense that the country could take on even more without any serious consequence.”1

What does this mean for you?

Follow your financial plan and ignore the noise. Remember that market downturns offer the chance to buy stocks at lower prices, which could position a portfolio well for future growth. Again, there are no guarantees that stocks will perform to anyone’s expectations, and decisions could result in losses including a possible loss in principal. But it may be helpful to remember that some investors use downturns as opportunities to buy stocks that were previously overvalued relative to their perceived earnings potential.

Data Sources: Pew Research Center, UsgovernmentSpending.com, FS Investments

New York Times – August 21, 2020 – We have crossed the line Debt Hawks Warned Us about for Decades

_____

This material contains an assessment of the market and economic environment at a specific point in time and is not intended to be a forecast of future events, or a guarantee of future results. Forward-looking statements are subject to certain risks and uncertainties. Actual results, performance, or achievements may differ materially from those expressed or implied. Information is based on data gathered from what we believe are reliable sources.

Using diversification as part of your investment strategy neither assures nor guarantees better performance and cannot protect against loss of principal due to changing market conditions.

Past performance is not a guarantee of future results.

The opinions expressed in this commentary are those of the author and may not necessarily reflect those held by Kestra Investment Services, LLC or Kestra Advisory Services, LLC. This is for general information only and is not intended to provide specific investment advice or recommendations for any individual. It is suggested that you consult your financial professional, attorney, or tax advisor with regard to your individual situation.

Securities offered through Kestra Investment Services, LLC (Kestra IS), member FINRA/SIPC. Investment Advisory Services offered through Kestra Advisory Services, LLC (Kestra AS) an affiliate of Kestra IS. CD Wealth Management and Bluespring Wealth Partners LLC* are affiliates of Kestra IS and Kestra AS.  Investor Disclosures: https://bit.ly/KF-Disclosures

*Bluespring Wealth Partners, LLC acquires and supports high quality investment adviser and wealth management companies throughout the United States.

3 reasons pandemic shutdowns seem unlikely

The news last week that President Trump has COVID-19 has shifted the narrative back to the potential risk of a second wave of COVID-19 lockdowns. If this were to occur, we would see a return to recession for the global economy and a bear market for stocks. 

Even as virus cases are on the rise around the world, as seen by Israel instituting a second national lockdown, the United Kingdom rolling out new restrictions, and new cases in France and Spain prompting politicians to consider similar measures, we believe that a return to widespread national lockdowns is unlikely for three reasons:

1. Healthcare systems are not overwhelmed.

The outbreak in Europe today is different from the outbreak in March and April, as it has not been accompanied by a spike in hospital admissions. At the same time, the hospitalization rate in the U.S. has fallen sharply, according to the U.S. Centers for Disease Control. The rise in new cases in Europe is not alarming when viewed as a percentage of those being tested, as seen in the chart below. The percentage of positive tests is trending upward mainly in France and Spain.

2. Huge economic costs are a factor.

The high economic and social costs make it more likely that governments will respond to new outbreaks with effective targeted restrictions rather than national lockdowns. Countries that deployed lockdowns earlier this year experienced large declines in economic activity, tens of millions of lost jobs and stock market declines.

3. Localized restrictions are paying off.

The U.S. experienced a spike in COVID-19 cases this summer. However, as seen in the chart below, the return of targeted restrictions in some states did not lead the economy back into a recession. In fact, the labor market continued to improve over the summer months, recovering almost half the jobs lost in March and April.

China also saw surges in cases in parts of its country and used localized and targeted restrictions. The International Monetary Fund now predicts that China will be the only country in the world to grow its economy, even though it experienced the first wave of COVID-19 at the beginning of the year, and then a second wave this summer.

What does this mean for you?

Continuing to focus on the fundamentals can help you weather the potential market response to an uptick in coronavirus cases. Follow your financial plan and ignore the noise. Remember that market downturns offer the chance to buy stocks at lower prices, which could position a portfolio well for future growth. There are no guarantees that stocks will perform to anyone’s expectations, and decisions could result in losses including a possible loss in principal, but it may be helpful to remember that some investors use downturns as opportunities to buy stocks that were previously overvalued relative to their perceived earnings potential.

Moreover, if you typically invest set amounts into your portfolio at regular intervals — a strategy known as dollar-cost averaging (DCA), which is commonly used in workplace retirement plans and college investment plans — you are using a method of investing that helps you behave like the value investors mentioned above. Through DCA, your investment dollars purchase fewer shares when prices are high, and more shares when prices drop. Over extended periods of volatility, DCA can result in a lower average cost for your holdings than the investment’s average price over the same time period.  DCA does not assure a profit or protect against a loss in declining markets.

We will continue to stay the course, just like we did during the national lockdown in March and April.  We remain hypervigilant going into the 4th quarter and will make tweaks to the portfolios when necessary.

Sources: Bloomberg, Charles Schwab, European CDC

_____

This material contains an assessment of the market and economic environment at a specific point in time and is not intended to be a forecast of future events, or a guarantee of future results.  Forward-looking statements are subject to certain risks and uncertainties.  Actual results, performance, or achievements may differ materially from those expressed or implied.  Information is based on data gathered from what we believe are reliable sources.

The opinions expressed in this commentary are those of the author and may not necessarily reflect those held by Kestra Investment Services, LLC or Kestra Advisory Services, LLC.  This is for general information only and is not intended to provide specific investment advice or recommendations for any individual.  It is suggested that you consult your financial professional, attorney, or tax advisor with regard to your individual situation.  

Securities offered through Kestra Investment Services, LLC (Kestra IS), member FINRA/SIPC. Investment Advisory Services offered through Kestra Advisory Services, LLC (Kestra AS) an affiliate of Kestra IS. Kestra IS and Kestra AS are not affiliated with CD Wealth Management. 

Coping with volatility in the market

As we approach the fourth quarter of 2020 and the upcoming presidential election, many investors are asking about volatility and how to potentially hedge the portfolio against future volatility.
 
In previous messages, we have discussed the volatility index, VIX, which is a measure of forward-looking volatility for the next 30 days. The VIX is known as the fear gauge, as it reflects the market’s short-term outlook for stock price volatility as derived from option prices on the S&P 500. The challenge with the VIX index is that investors can’t access the VIX index; you can’t purchase it. 
 
In a chart that we recently shared on volatility, higher volatility looks like it will last into next year, regardless of the election outcome or the arrival of a vaccine against COVID-19. 

The VIX can remain elevated long after the depths of a crisis. For example, for most of 2009, the index hovered in the mid-20s range. A reading below 20 in the VIX suggests investors perceive market risk to be low, while a reading above 30 indicates more nervousness in the market. The VIX has been trading between 25 and 30 for most of September 2020.

The chart above clearly highlights the large moves to the upside in the VIX index– 1998 Long Term Capital Management blow up, 2000 tech bubble, 2008-2009 financial crisis, 2011 downgrade of US debt, and most recently the COVID-19 pandemic. So the question still remains, how does one protect themselves from increased volatility in their portfolio? If we could, the easy answer would be to buy the VIX index as a hedge in the portfolio to guard against increased market volatility leading to the stock market going down. 
 
However, as we previously stated, investors can’t purchase the VIX index.  Some investors purchase complicated index funds that attempt to replicate the volatility index through futures-based pricing or invest in hedge funds or other alternative investments, while others trade options – all in the “hope” of mitigating risk or volatility. All the above, however, have significant risk and investment challenges and none are the panacea for increased market volatility.

We believe that the key is to stay the course and not try to time the market.  It all starts with a solid financial plan for the long run that understands the level of risk that is acceptable for each client. With regards to investments, we believe in diversification and having different asset classes that allow you to stay invested. The best option is to stick with a broadly diversified portfolio that can help you to achieve your own specific financial goals – regardless of market volatility. The economy, and therefore, the market, is bigger than the direction the political winds are blowing. Ultimately, it’s the long-term fundamentals that matter.
 
We want our clients to continue to focus on the following as we will continue staying the course of their financial plans and being proactive to make specific strategic moves in the portfolios that have proven necessary during these times:

Revisit Your Investment & Financial Planning Objectives: For nearly all investors, longer-term objectives are made possible when taking an appropriate level of risk.

Continue to Maintain a Longer-Term Mindset: Avoid letting recent market volatility convince you to abandon your prudently designed, long-term investment plan. Short-term reactive decisions could significantly impair portfolio returns.

Excess Cash Reserves: Continue to contribute according to your periodic investment plans as investing a portion of your excess cash reserves.

_____

This material contains an assessment of the market and economic environment at a specific point in time and is not intended to be a forecast of future events, or a guarantee of future results.  Forward-looking statements are subject to certain risks and uncertainties.  Actual results, performance, or achievements may differ materially from those expressed or implied.  Information is based on data gathered from what we believe are reliable sources.

The opinions expressed in this commentary are those of the author and may not necessarily reflect those held by Kestra Investment Services, LLC or Kestra Advisory Services, LLC.  This is for general information only and is not intended to provide specific investment advice or recommendations for any individual.  It is suggested that you consult your financial professional, attorney, or tax advisor with regard to your individual situation.

Securities offered through Kestra Investment Services, LLC (Kestra IS), member FINRA/SIPC. Investment Advisory Services offered through Kestra Advisory Services, LLC (Kestra AS) an affiliate of Kestra IS. Kestra IS and Kestra AS are not affiliated with CD Wealth Management.

A deeper look at the stock selloff

Last week was a good reminder that stocks cannot go up all the time. The previous five weeks saw signs of investor exuberance after both Apple and Tesla announced stock splits and market volatility continued to drop at the same time. 

The same stocks that led the NASDAQ and S&P 500 higher were the same ones that fell the most last week. As seen in the chart below, Large Cap Growth stocks and the NASDAQ, since the market bottom in March, have significantly outpaced value stocks, and the selloff last week is an effort to reduce the spreads between growth and value stocks.

The reasons for the market pullback were the usual reasons: slowing recovery, tech stock bubble and an upcoming election. We do not think that the selloff last week is the beginning of a correction. 

When stock valuations get stretched, as they recently have in the technology sector, they tend to snap back, much like a rubber band. If markets move too far in one direction, either oversold or overbought, they typically need to “reset” before moving higher, what many call profit taking. However, much of the volatility last week is being blamed on offshore funds option trading that led to large amounts of technology stock options being purchased. If this is the case, we expect this to be nothing more than a short-term move down in the markets.

The VIX Index, which is a measure of forward volatility for the next 30 days, is flashing higher volatility than normal. The election is a big reason that the forward curve of the VIX index is steep as seen below. After we know who the next president will be, volatility is expected to level off.

While the market sold off last week, we saw interest rates rise and gold prices fall. This is not typical behavior of a market correction. Employment data continues to improve as the unemployment rate fell to 8.4 percent, well below expectations, and down from the high of 22 percent back in April. 

The improvement in the labor market has been an unexpected source of strength for the economy. The expectation is that the pace of the rebound will begin to moderate, however, the pace of recovery remains ahead of forecast.

What to watch next

Now that Labor Day is behind us, the focus for the markets turns to stimulus talks and the election. Last week, Congress passed a resolution on the budget to avoid a government shutdown. It also may mean that stimulus talks may be stalled for the rest of the year. The markets will be watching the political scene closely and will dominate the news well beyond Nov. 3.

So, what can we learn from all this?  Staying the course during periods of market volatility is critical for the long-term success of your financial plan. We will continue to closely track the markets, the sector rotation and continue to tweak the portfolios as necessary.

This material contains an assessment of the market and economic environment at a specific point in time and is not intended to be a forecast of future events, or a guarantee of future results. Forward-looking statements are subject to certain risks and uncertainties. Actual results, performance, or achievements may differ materially from those expressed or implied. Information is based on data gathered from what we believe are reliable sources.

Using diversification as part of your investment strategy neither assures nor guarantees better performance and cannot protect against loss of principal due to changing market conditions.

Past performance is not a guarantee of future results.

The opinions expressed in this commentary are those of the author and may not necessarily reflect those held by Kestra Investment Services, LLC or Kestra Advisory Services, LLC. This is for general information only and is not intended to provide specific investment advice or recommendations for any individual. It is suggested that you consult your financial professional, attorney, or tax advisor with regard to your individual situation.

Securities offered through Kestra Investment Services, LLC (Kestra IS), member FINRA/SIPC. Investment Advisory Services offered through Kestra Advisory Services, LLC (Kestra AS) an affiliate of Kestra IS. CD Wealth Management and Bluespring Wealth Partners LLC* are affiliates of Kestra IS and Kestra AS.  Investor Disclosures: https://bit.ly/KF-Disclosures

*Bluespring Wealth Partners, LLC acquires and supports high quality investment adviser and wealth management companies throughout the United States.