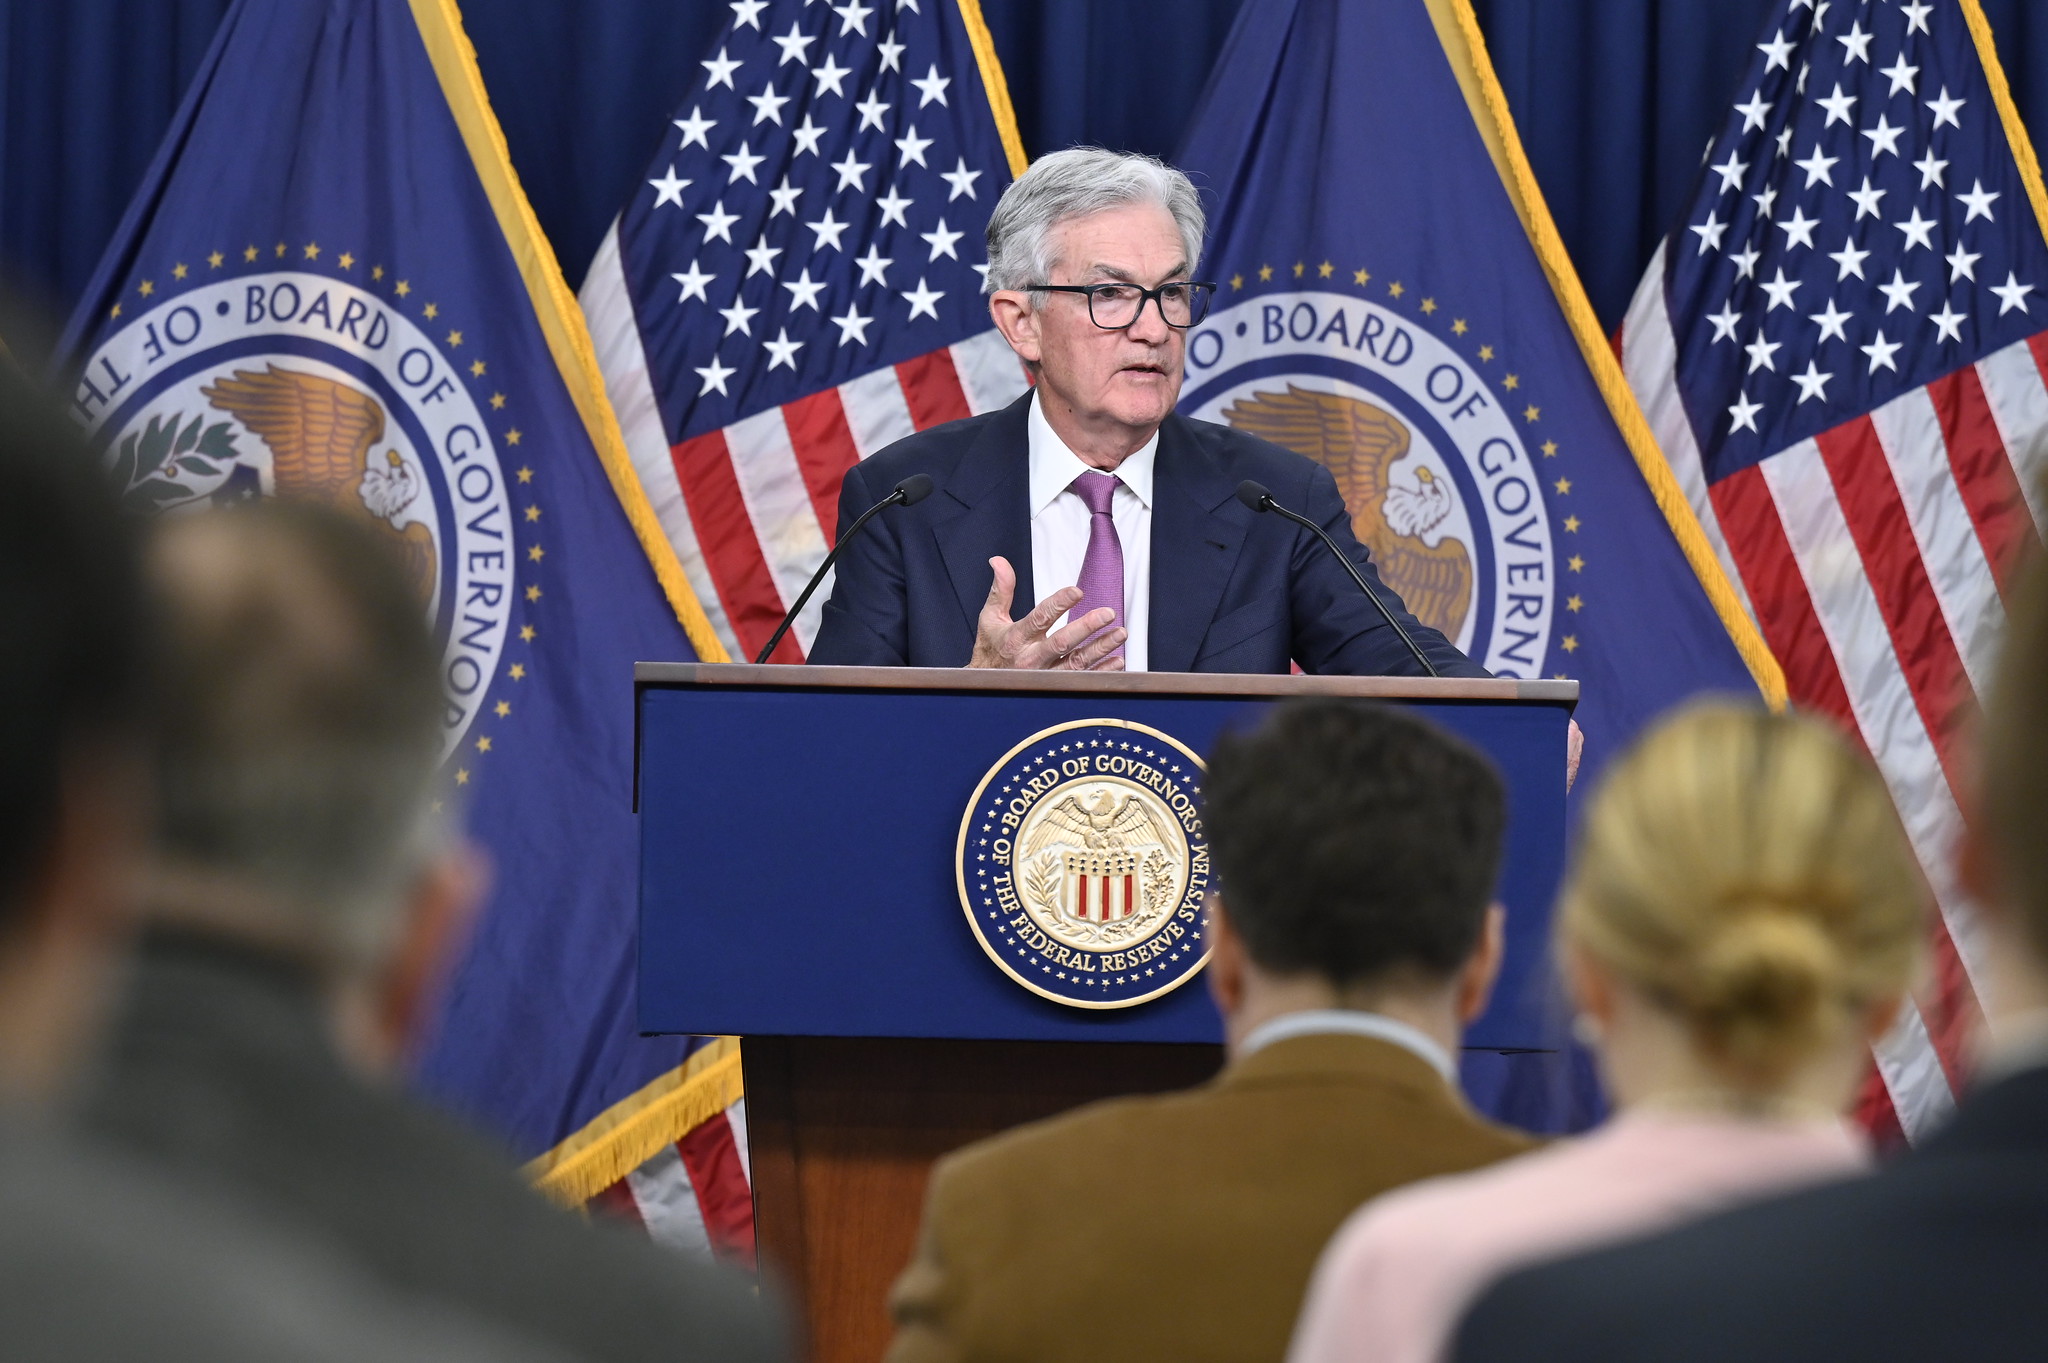
The Federal Reserve announced another rate hike last week, raising the federal funds rate to a range from 4.5% to 4.75%. Though it appears the Fed may be close to the end of its rate-hiking cycle, additional increases are still likely — probably more similar in size to 25 basis points than the more aggressive rate hikes of 75 basis points that we saw last year. The Fed’s statement said that “ongoing increases in the target range” would be appropriate. Fed Chairman Jerome Powell said that “while recent developments are encouraging, we will need substantially more evidence to be confident that inflation is on a sustained downward path.” He also said rate cuts later this year are not likely.
Some key highlights from the Fed’s take on the economy and next steps:
• The U.S. economy slowed significantly in 2022, but indicators suggest modest growth in the first quarter of the year. (Remember that fourth-quarter GDP was 2.9%.)
• Ongoing increases in the federal funds rate are appropriate, and “history argues against relaxing policy prematurely.”
• Shifting to a slower pace of rate hikes allows the Fed to better gauge how the economy is responding.
• The Fed’s focus is on sustained changes, not short-term moves.
• Regarding the debt ceiling: “Nobody should assume the Fed can save the economy if there is a default.” The only way forward is for Congress to raise the debt ceiling limit.
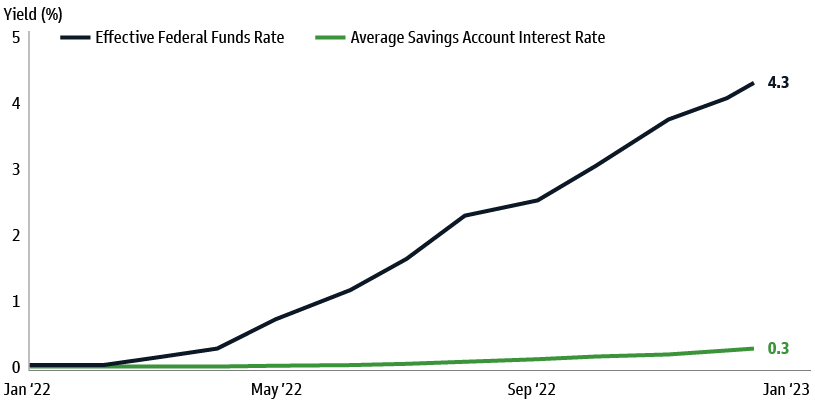
Even as the Federal Reserve raised rates by 25 basis points last week — its eighth hike since 2002 — savings account rates have remained low. With inflation at its highest level in four decades, the cost of holding cash is magnified as investors are left with a reality of negative real savings rates. As the chart below illustrates, the average savings account interest rate is paying .3%, while the effective federal funds rate is now 4.5%. Major banks continue to offer little in the way of savings rates.
More attractive yields exist for those with excess cash, whether in money market funds or short-duration fixed income, such as Treasury bills. To put this in dollar terms, if you have $100,000 in a savings account earning .3% per year, you will earn $300 in interest. That same $100,000 earning 4% in money market or Treasuries earns $4,000 a year in interest income — an increase of $3,700 for sitting in cash! That is a significant number of dollars potentially being left on the table.
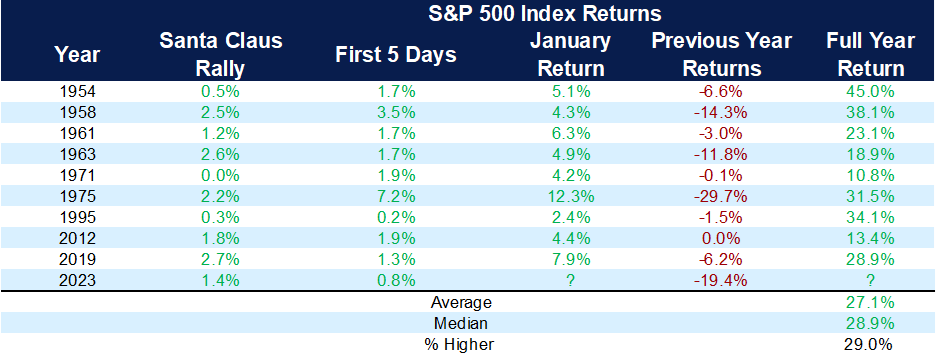
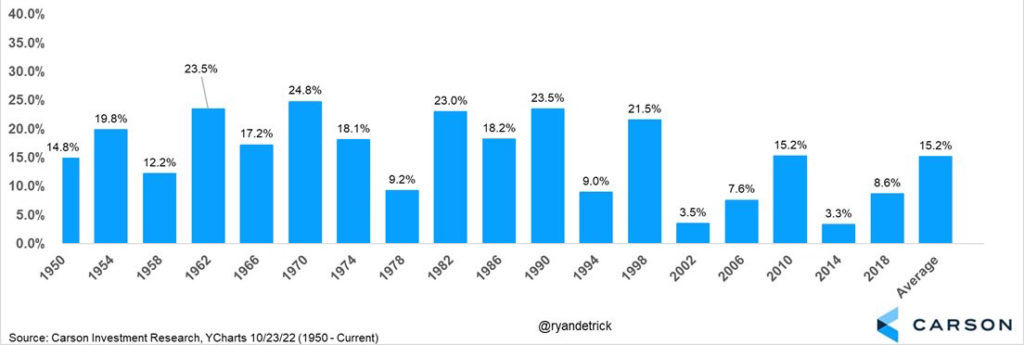
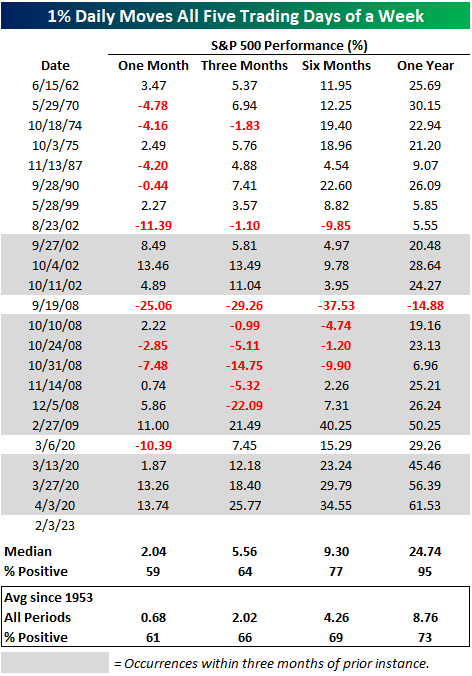
On the back of the Fed announcement and Friday’s very strong job report (517,000 new jobs were created in January, and the unemployment rate fell to a 53-year low of 3.4%), the market (S&P 500) experienced moves of more than 1% all five days last week. This has happened only 23 times since 1953.
The chart below shows that when this has occurred, the average return has been almost 25% one year later. The bond market also experienced volatility, initially moving higher to start the week and then dropping based on the Fed statement, only to rally on Friday and send yields higher after the job report.
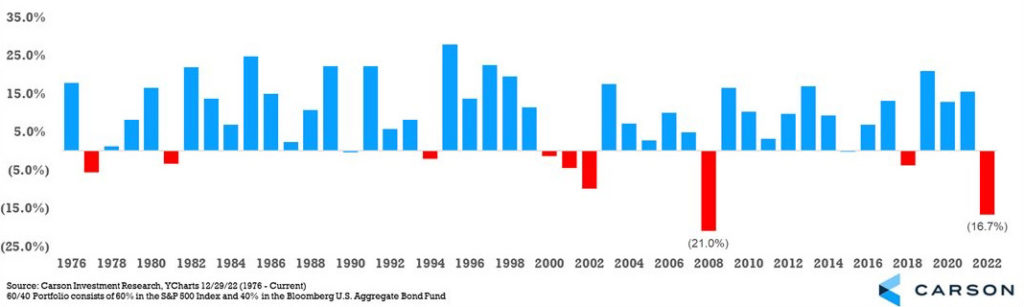
The bond market is now pricing in that the Fed may make one more rate hike next month and that it may not cut rates later this year. The recent GDP and labor reports show that this economy is not in a recession. There are pockets of the economy — such as housing — that are in a recession, but the overall economy remains resilient.
As long as demand (GDP) and employment remain as strong as they are, the Fed will remain hesitant to cut rates and may even continue to raise them past the 5% federal fund target level. Remember, the stock market is a leading indicator, and it should lead the economy as it eventually stabilizes.
The CD Wealth Formula
We help our clients reach and maintain financial stability by following a specific plan, catered to each client.
Our focus remains on long-term investing with a strategic allocation while maintaining a tactical approach. Our decisions to make changes are calculated and well thought out, looking at where we see the economy is heading. We are not guessing or market timing. We are anticipating and moving to those areas of strength in the economy — and in the stock market.
We will continue to focus on the fact that what really matters right now is time in the market, not out of the market. That means staying the course and continuing to invest, even when the markets dip, to take advantage of potential market upturns. We continue to adhere to the tried-and-true disciplines of diversification, periodic rebalancing and looking forward, while not making investment decisions based on where we have been.
It is important to focus on the long-term goal, not on one specific data point or indicator. Long-term fundamentals are what matter. In markets and moments like these, it is essential to stick to the financial plan. Investing is about following a disciplined process over time.
Sources: Bespoke, Goldman Sachs, Schwab

This material contains an assessment of the market and economic environment at a specific point in time and is not intended to be a forecast of future events, or a guarantee of future results. Forward-looking statements are subject to certain risks and uncertainties. Actual results, performance, or achievements may differ materially from those expressed or implied. Information is based on data gathered from what we believe are reliable sources.
Using diversification as part of your investment strategy neither assures nor guarantees better performance and cannot protect against loss of principal due to changing market conditions.
Past performance is not a guarantee of future results.
The opinions expressed in this commentary are those of the author and may not necessarily reflect those held by Kestra Investment Services, LLC or Kestra Advisory Services, LLC. This is for general information only and is not intended to provide specific investment advice or recommendations for any individual. It is suggested that you consult your financial professional, attorney, or tax advisor with regard to your individual situation.
Securities offered through Kestra Investment Services, LLC (Kestra IS), member FINRA/SIPC. Investment Advisory Services offered through Kestra Advisory Services, LLC (Kestra AS) an affiliate of Kestra IS. CD Wealth Management and Bluespring Wealth Partners LLC* are affiliates of Kestra IS and Kestra AS. Investor Disclosures: https://bit.ly/KF-Disclosures
*Bluespring Wealth Partners, LLC acquires and supports high quality investment adviser and wealth management companies throughout the United States.