We continue to watch the battle of the Federal Reserve vs. inflation play out in front of us. Will inflation continue to drop? Did the Fed move too early in reducing rate hikes? Will the Fed continue to raise rates longer if inflation remains persistent? Will additional rate hikes cause further pressure on the regional banks?
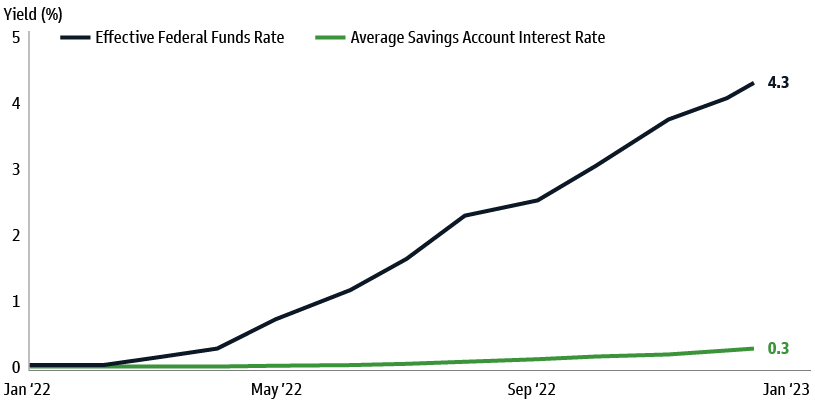
The Federal Reserve is facing one of its most difficult policy decisions as it grapples with stubborn inflation data and a simmering bank crisis. The Fed announced Wednesday it is raising rates another 25 basis points; the Federal Funds rate is now 4.75% to 5%.
Inflation started picking up in the spring of 2021 as the economy came roaring back from the pandemic. At first, the Fed dismissed the resurgent price spikes as temporary or transitory, assuming they would resolve themselves when supply chains returned to normal. As we know now, supply bottlenecks lasted longer than expected, and inflation is still the main topic of conversation almost two years later.
By June of last year, the consumer price index was 9.1% higher than the year before and the highest in four decades. The Fed raised rates for the first time a year ago, in March 2022, and it has now raised rates nine times. Inflation has edged lower since the peak in mid-2022. However, the Fed has not yet won the war with inflation; new data show an upturn in inflation and a stronger-than-expected economy.
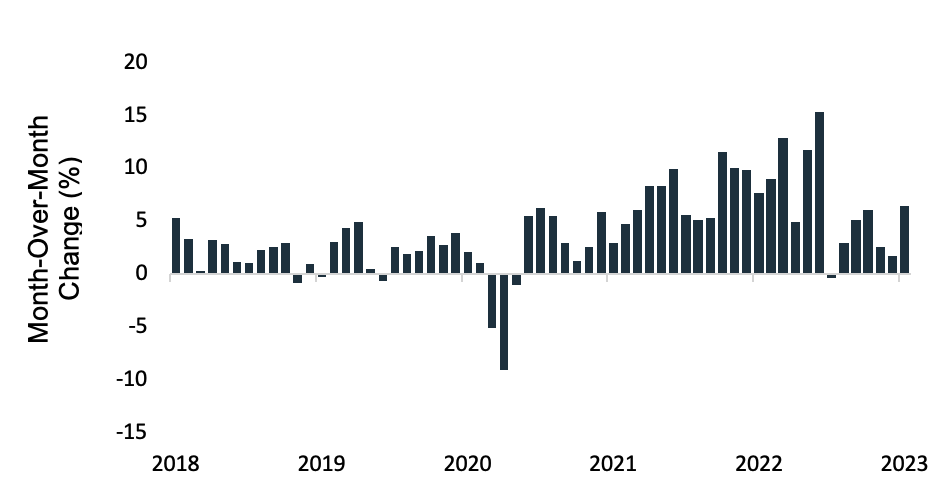
Consumer Price Index: All Items, Month Over Month
A concern is that inflation may prove harder to slow than initially thought. Households have increasingly shifted spending away from physical goods to experiences, such as traveling, restaurants and entertainment. Inflationary pressures also have shifted from goods to services. With all these moving parts, what are the factors that make up inflation?
Inflation can be separated into three broad categories – goods, shelter and wages. Right now, each group is fighting its own fight:
• Goods prices include a variety of tangible items such as eggs, cars or gasoline. Prices of goods tend to move quicker than others. We have all experienced a quick rise in gas prices. More recently, the egg shortage due to the avian flu has caused prices to rise dramatically. Consumer durable goods — those that don’t have to be purchased frequently, such as appliances, computers or televisions — are lower than they were a year ago, and leading indicators suggest further price easing still is to come.
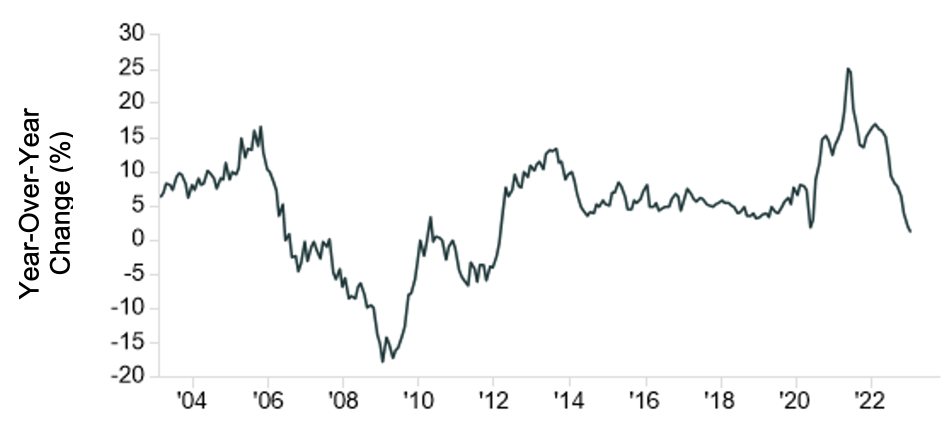
• Shelter prices consist of two major components: home prices and rents. Both tend to move more slowly than prices of goods. We are starting to see signs of easing in this category. As of January, existing U.S. home sales had decreased for 12 consecutive months. In January, the median sales price of existing homes increased by 1.3%, the smallest gain since February 2012.
Year-Over-Year Median Sales Price of Existing Homes
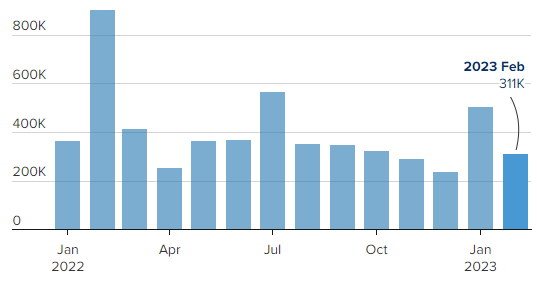
• Wages tend to move much more slowly, and once they are elevated, become more difficult for the Fed to reduce. Jobs remain plentiful as employers added 517,000 jobs in January and 311,000 in February. The unemployment rate moved up to 3.6% but remains close to historically low levels. Average hourly earnings rose 4.6% from a year ago, but this was less than expected and may be a sign of easing wage pressures.
Monthly Job Creation in the U.S.
January 2022 through February 2023
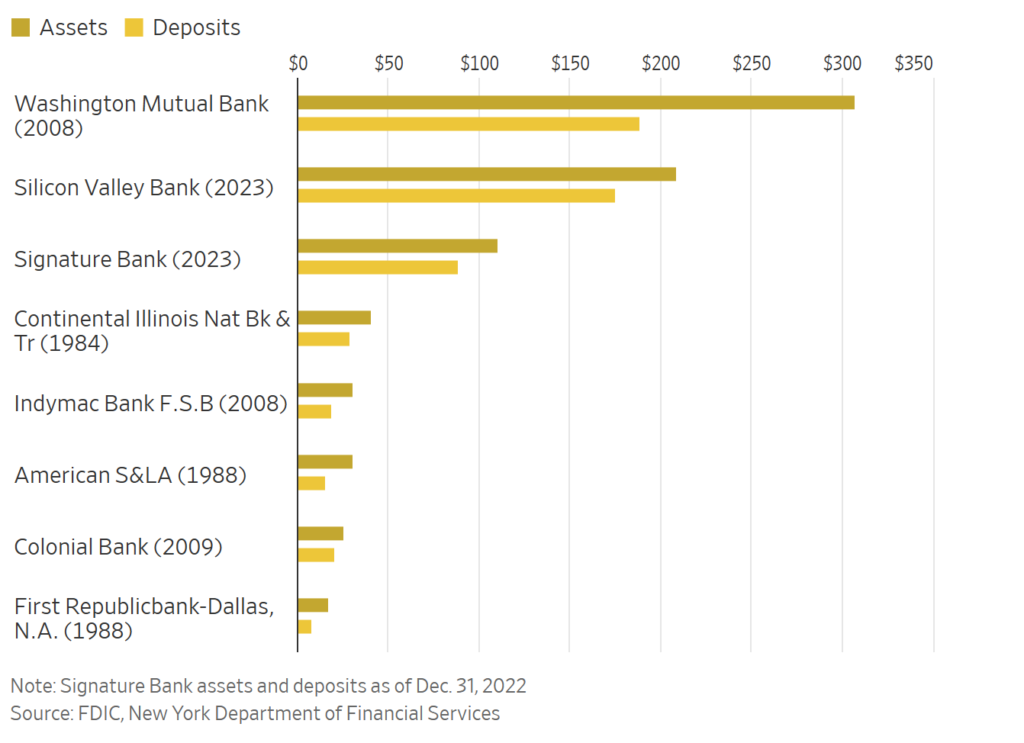
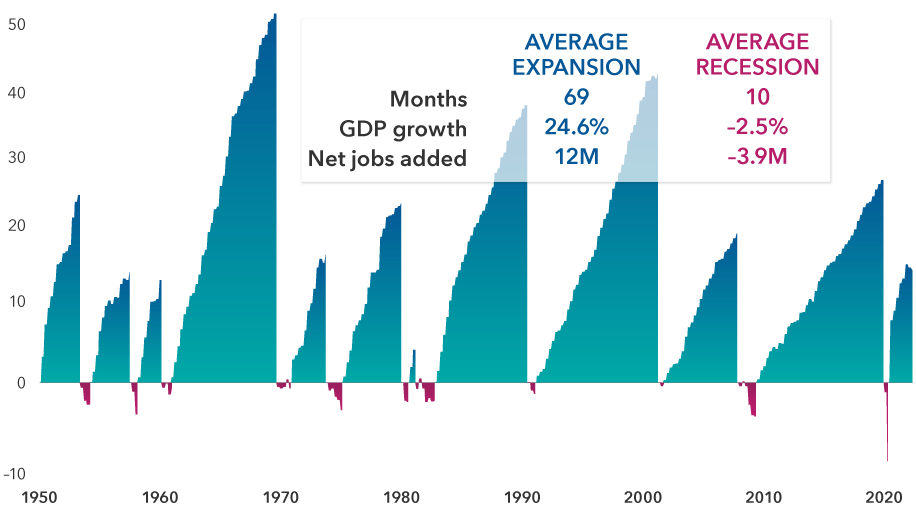
The Federal Reserve has a tough battle on its hands between inflation, the recession and the banking crisis. How much can the Fed raise rates now that several banks have collapsed under the weight of eight interest rate hikes in a year?
The fight over the Fed being data-dependent, how much to continue raising rates and how much to keep the economy from a hard landing into a recession will lead to continued volatility and turbulence. It is important to remember that it does take time — typically 12 to 18 months — for rate hikes to work their way through the economy, and the Fed is taking that into consideration.
It is also important to remember that the stock market is forward-looking and efficient. Publicly known data is already priced into the market. It is the unknown economic data and the Fed’s reaction that we will continue to monitor and keep you updated about along the way.
The CD Wealth Formula
We help our clients reach and maintain financial stability by following a specific plan, catered to each client.
Our focus remains on long-term investing with a strategic allocation while maintaining a tactical approach. Our decisions to make changes are calculated and well thought out, looking at where we see the economy is heading. We are not guessing or market timing. We are anticipating and moving to those areas of strength in the economy — and in the stock market.
We will continue to focus on the fact that what really matters right now is time in the market, not out of the market. That means staying the course and continuing to invest, even when the markets dip, to take advantage of potential market upturns. We continue to adhere to the tried-and-true disciplines of diversification, periodic rebalancing and looking forward, while not making investment decisions based on where we have been.
It is important to focus on the long-term goal, not on one specific data point or indicator. Long-term fundamentals are what matter. In markets and moments like these, it is essential to stick to the financial plan. Investing is about following a disciplined process over time.
Sources: AP, CNBC, Kestra Investment Management

This material contains an assessment of the market and economic environment at a specific point in time and is not intended to be a forecast of future events, or a guarantee of future results. Forward-looking statements are subject to certain risks and uncertainties. Actual results, performance, or achievements may differ materially from those expressed or implied. Information is based on data gathered from what we believe are reliable sources.
Using diversification as part of your investment strategy neither assures nor guarantees better performance and cannot protect against loss of principal due to changing market conditions.
Past performance is not a guarantee of future results.
The opinions expressed in this commentary are those of the author and may not necessarily reflect those held by Kestra Investment Services, LLC or Kestra Advisory Services, LLC. This is for general information only and is not intended to provide specific investment advice or recommendations for any individual. It is suggested that you consult your financial professional, attorney, or tax advisor with regard to your individual situation.
Securities offered through Kestra Investment Services, LLC (Kestra IS), member FINRA/SIPC. Investment Advisory Services offered through Kestra Advisory Services, LLC (Kestra AS) an affiliate of Kestra IS. CD Wealth Management and Bluespring Wealth Partners LLC* are affiliates of Kestra IS and Kestra AS. Investor Disclosures: https://bit.ly/KF-Disclosures
*Bluespring Wealth Partners, LLC acquires and supports high quality investment adviser and wealth management companies throughout the United States.
Fidelity Investments and Fidelity Institutional® (together “Fidelity”) is an independent company, unaffiliated with Kestra Financial or CD Wealth Management. Fidelity is a service provider to both. There is no form of legal partnership, agency affiliation, or similar relationship between your financial advisor and Fidelity, nor is such a relationship created or implied by the information herein. Fidelity has not been involved with the preparation of the content supplied by CD Wealth Management and does not guarantee, or assume any responsibility for, its content. Fidelity Investments is a registered service mark of FMR LLC. Fidelity Institutional provides clearing, custody, or other brokerage services through National Financial Services LLC or Fidelity Brokerage Services LLC, Members NYSE, SIPC.