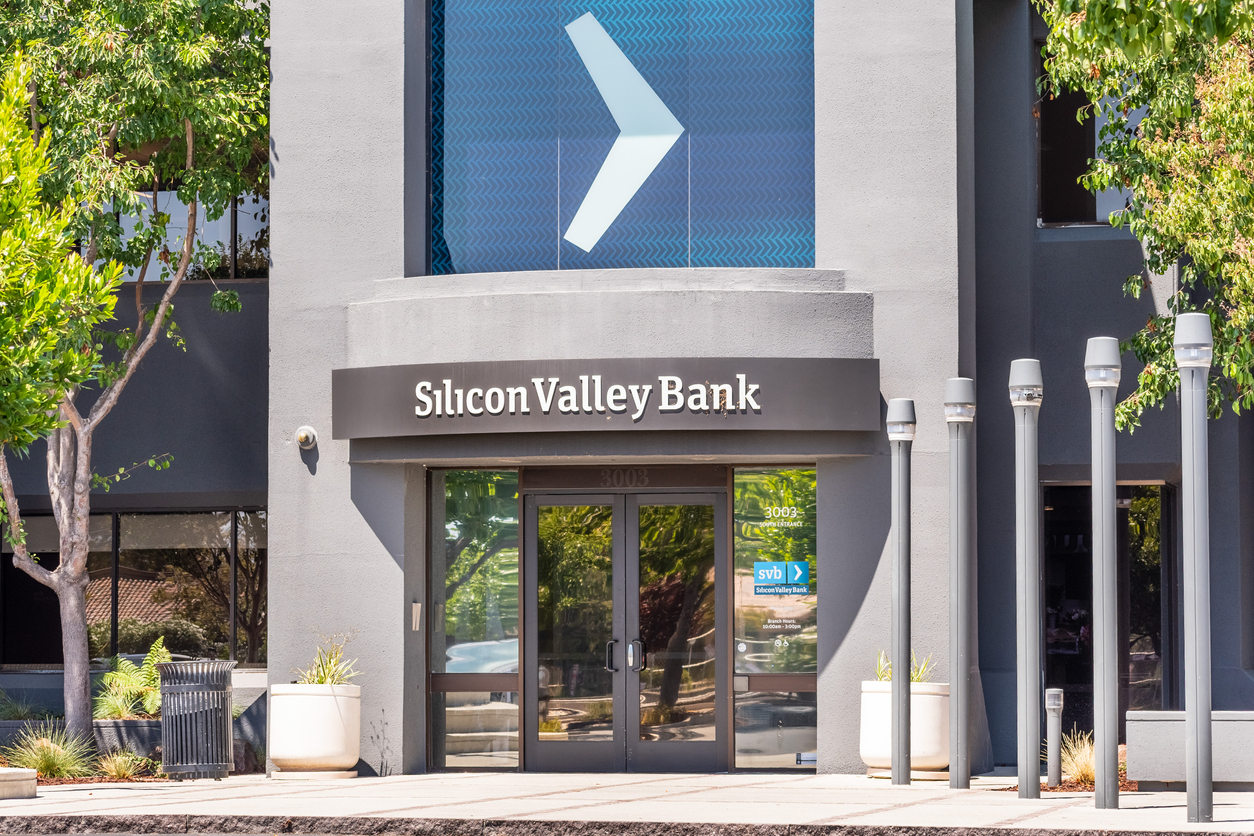
Last week, the financial markets experienced a shock not seen since the days of the Great Financial Crisis in 2008. The second-largest bank failure on record happened when Silicon Valley Bank (SVB) shut its doors on Friday after it was unable to meet the demands for its customers to redeem their money. SVB was a nearly 40-year-old bank that primarily served the tech world along with private equity and venture capitalists.
Clearly, the sudden nature of SVB’s collapse caught the banking world by surprise. Within 48 hours, the bank went from trading over $300 per share to being shut down. Venture capital companies helped lead the run on the bank, withdrawing more than $42 billion by Thursday. The bank was mismanaged in many ways, and its management has questions to answer. SVB took in a large amount of deposits from 2019 through 2021. With those monies, the bank purchased longer-dated Treasuries to earn interest on the cash and help with the spread on what it was lending out.
Over the last 12 months, the Fed has raised interest rates eight times. When rates rise, bond prices fall. Longer-dated bonds have more volatility, so their prices tend to fall more than shorter-maturity bonds.
Last week, when SVB clients started to demand their monies as rumors of the bank’s losses mounted, the bank had to sell more bonds at a large loss due to the rise in rates. SVB had not put proper hedges in place to manage interest rate risk and exposed its clients to these losses. We do not believe that this is an industrywide issue or that there will be runs on other banks.
Could other banks have a similar fate to SVB? The short answer is yes. But remember: After both the Great Depression and the Great Financial Crisis, processes and procedures were put in place for this very reason.
A large percentage of the bank’s deposits were uninsured, i.e., over the FDIC-insured limits of $250,000 per person and $500,000 for a married couple. Many companies used SVB for their banking, and companies like Roku had an estimated $487 million in deposits at SVB. Smaller tech companies also had their cash there and are now trying to figure out a way to meet payroll.
The Federal Reserve said it is taking actions to protect the U.S. economy by strengthening public confidence in the banking system. This step will ensure that the banking system continues to perform its vital roles of protecting deposits and providing access to credit to households and businesses in a manner that promotes strong and sustainable economic growth.
Depositors will have access to all of their money starting Monday, March 13. No losses associated with the resolution of SVB will be assumed by the taxpayer.
The Fed also announced a similar systemic risk exception for New York-based Signature Bank. All depositors of this institution will be made whole. As with the resolution of SVB, no losses will be assumed by the taxpayer.
Shareholders and certain unsecured debtholders will not be protected. Senior management has also been removed. Any losses to the Deposit Insurance Fund to support uninsured depositors will be recovered by a special assessment on banks, as required by law.
As the week progresses, we should learn more about what the government, Federal Reserve or FDIC may do to continue to calm the waters.
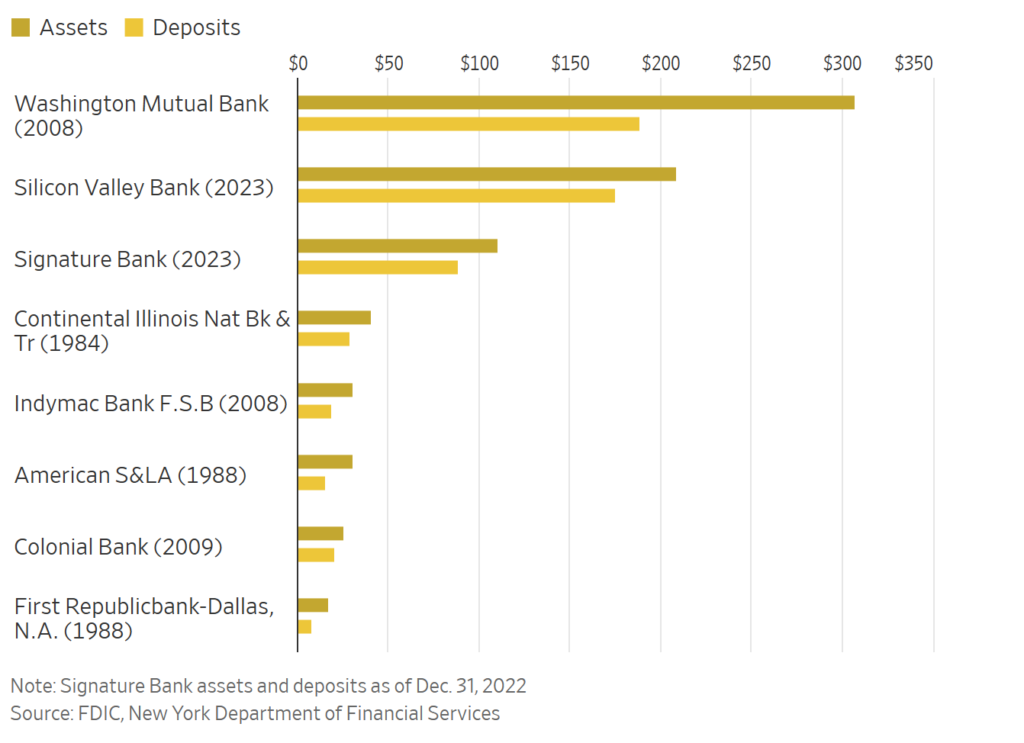
Biggest Bank Failures
We want to remind and reassure you of the financial strength of Fidelity and the power of independence and team behind CD Wealth Management. The chart below outlines the approach CD Wealth takes with our clients. We do not take custody of any assets. We are the team that works with you to create your plan, oversee your monies and guide you on a daily basis. We invest your assets in the public, liquid markets. Your assets are custodied, or held, at Fidelity Institutional®. Fidelity is not a bank like SVB, or even Chase, Bank of America or Wells Fargo. Fidelity does not take in deposits to then make loans for homes, mortgages, businesses, etc. It is not investing your monies in bonds to make a spread on deposits as banks are.
Fidelity is a clearing house to hold your monies, whether in cash, stocks, bonds, mutual funds or exchange traded funds. It is important to understand and feel confident that institutions like Fidelity and Vanguard are not in the same business as commercial banks. That is why we choose to use them and not blur the lines between banking and investment management.

Please know that we have full faith and confidence in the banking system today. Most importantly, we have full faith and confidence in where your monies are being held (Fidelity Institutional®) and in the money markets where your monies are being invested. Please do not hesitate to reach out with any questions that you have.
The CD Wealth Formula
We help our clients reach and maintain financial stability by following a specific plan, catered to each client.
Our focus remains on long-term investing with a strategic allocation while maintaining a tactical approach. Our decisions to make changes are calculated and well thought out, looking at where we see the economy is heading. We are not guessing or market timing. We are anticipating and moving to those areas of strength in the economy — and in the stock market.
We will continue to focus on the fact that what really matters right now is time in the market, not out of the market. That means staying the course and continuing to invest, even when the markets dip, to take advantage of potential market upturns. We continue to adhere to the tried-and-true disciplines of diversification, periodic rebalancing and looking forward, while not making investment decisions based on where we have been.
It is important to focus on the long-term goal, not on one specific data point or indicator. Long-term fundamentals are what matter. In markets and moments like these, it is essential to stick to the financial plan. Investing is about following a disciplined process over time.
Sources: Bloomberg, CNBC, FDIC, CD Wealth Management

This material contains an assessment of the market and economic environment at a specific point in time and is not intended to be a forecast of future events, or a guarantee of future results. Forward-looking statements are subject to certain risks and uncertainties. Actual results, performance, or achievements may differ materially from those expressed or implied. Information is based on data gathered from what we believe are reliable sources.
Using diversification as part of your investment strategy neither assures nor guarantees better performance and cannot protect against loss of principal due to changing market conditions.
Past performance is not a guarantee of future results.
The opinions expressed in this commentary are those of the author and may not necessarily reflect those held by Kestra Investment Services, LLC or Kestra Advisory Services, LLC. This is for general information only and is not intended to provide specific investment advice or recommendations for any individual. It is suggested that you consult your financial professional, attorney, or tax advisor with regard to your individual situation.
Securities offered through Kestra Investment Services, LLC (Kestra IS), member FINRA/SIPC. Investment Advisory Services offered through Kestra Advisory Services, LLC (Kestra AS) an affiliate of Kestra IS. CD Wealth Management and Bluespring Wealth Partners LLC* are affiliates of Kestra IS and Kestra AS. Investor Disclosures: https://bit.ly/KF-Disclosures
*Bluespring Wealth Partners, LLC acquires and supports high quality investment adviser and wealth management companies throughout the United States.
Fidelity Investments and Fidelity Institutional® (together “Fidelity”) is an independent company, unaffiliated with Kestra Financial or CD Wealth Management. Fidelity is a service provider to both. There is no form of legal partnership, agency affiliation, or similar relationship between your financial advisor and Fidelity, nor is such a relationship created or implied by the information herein. Fidelity has not been involved with the preparation of the content supplied by CD Wealth Management and does not guarantee, or assume any responsibility for, its content. Fidelity Investments is a registered service mark of FMR LLC. Fidelity Institutional provides clearing, custody, or other brokerage services through National Financial Services LLC or Fidelity Brokerage Services LLC, Members NYSE, SIPC.