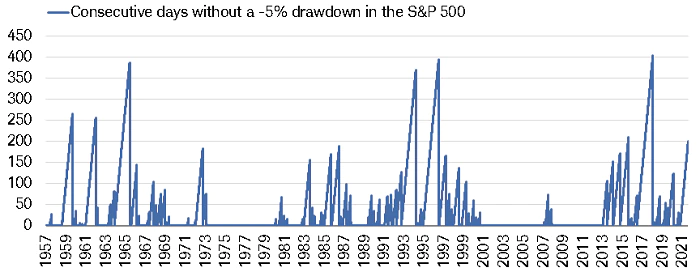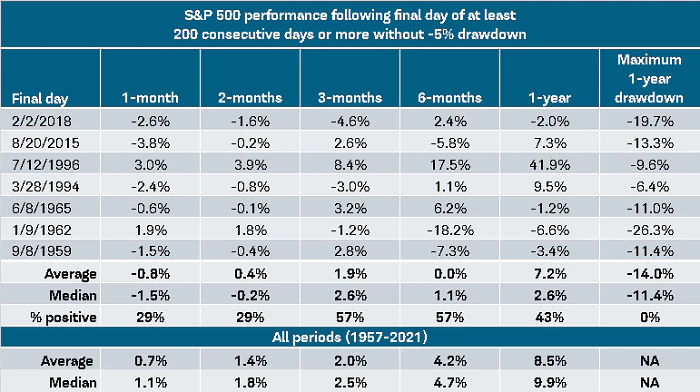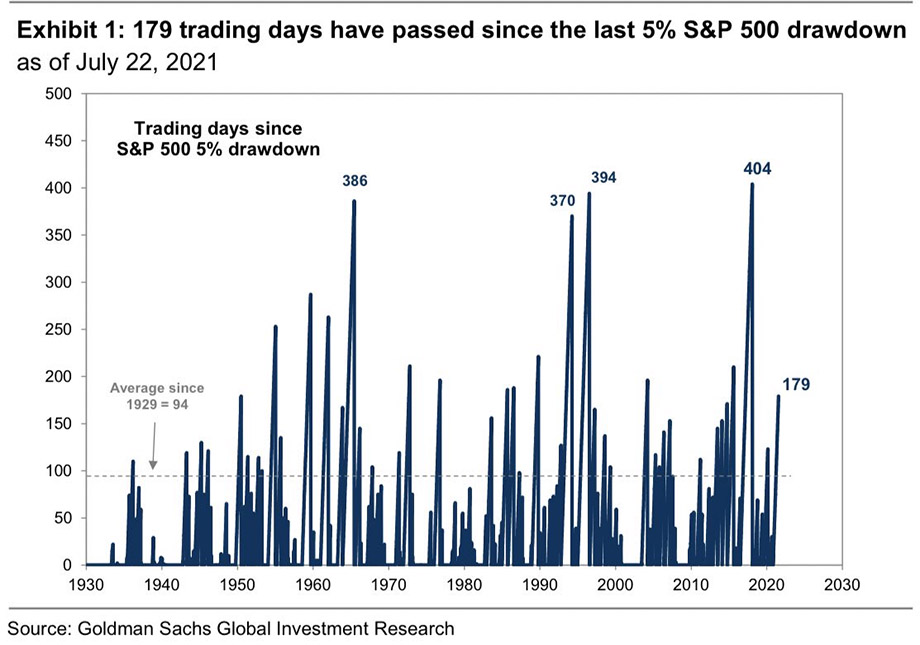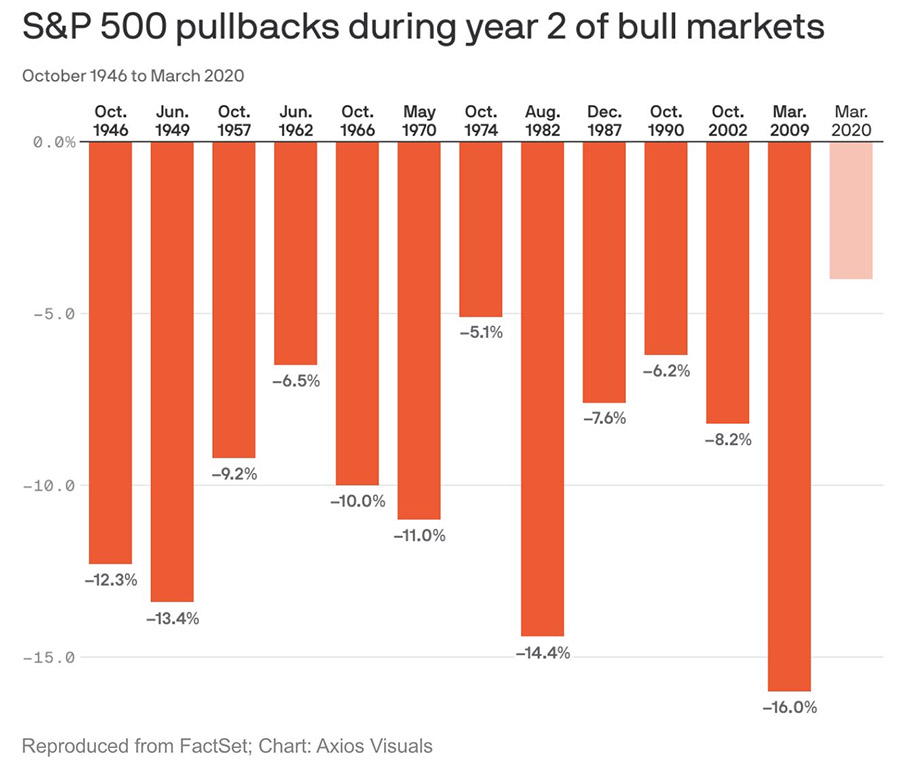
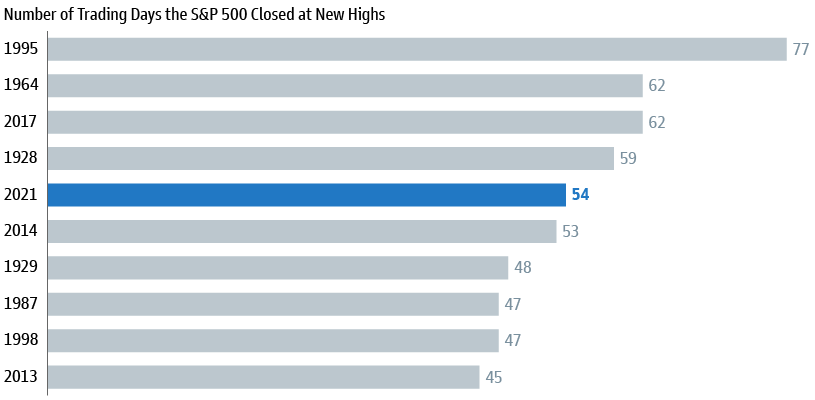
The S&P 500 closed at new highs 54 times in the first eight months of the year, with almost one-third of the trading days in 2021 seeing records. That’s the highest annual rate of record highs. August was the seventh consecutive positive month, marking the longest winning streak since January 2018, and as we recently wrote, the maximum drawdown so far this year in the S&P 500 has been 4.2%.
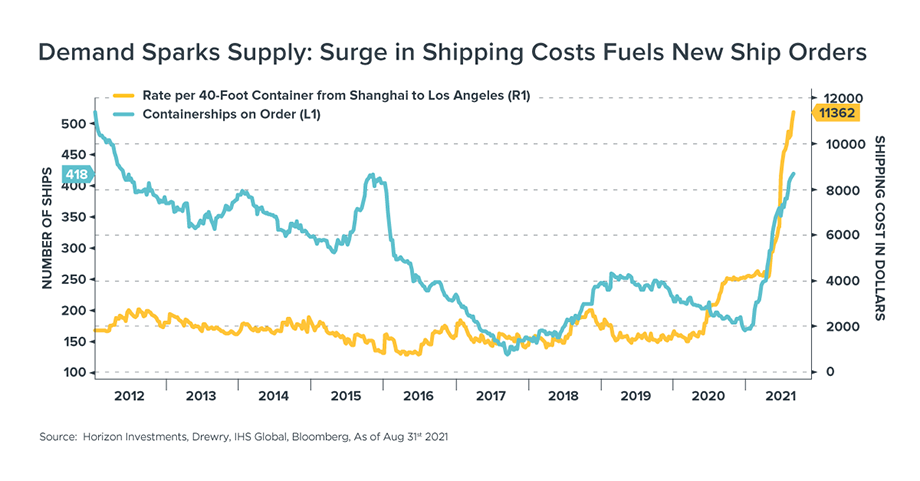
Inflation continues to be top of mind for many investors. We continue to see different sectors of the economy having a spike in prices: First it was lumber, then wholesale used car prices. Now, it’s the cost of shipping goods; the shipping industry is the latest to suffer in the supply-and-demand war. The price of sending a 40-foot container from Shanghai to Los Angeles looks like the chart of a meme stock, shooting straight up (172%) in a very short period.
Why is this occurring? Supply and demand.
Ships are stuck in port because China closed certain ports due to COVID outbreaks, and U.S. companies are increasing orders to meet upcoming holiday demand. As we have discussed before, when demand outpaces supply, the price of goods rises. Prices eventually rise to an extent where demand then falls. Then the supply of goods finally catches up to the demand, and prices continue to fall as excess goods flood the market. On the positive side, the demand for new containers being ordered is strong. It takes time for these containers to be built — possibly more than a year — and once the supply of containers is more plentiful, prices can normalize.
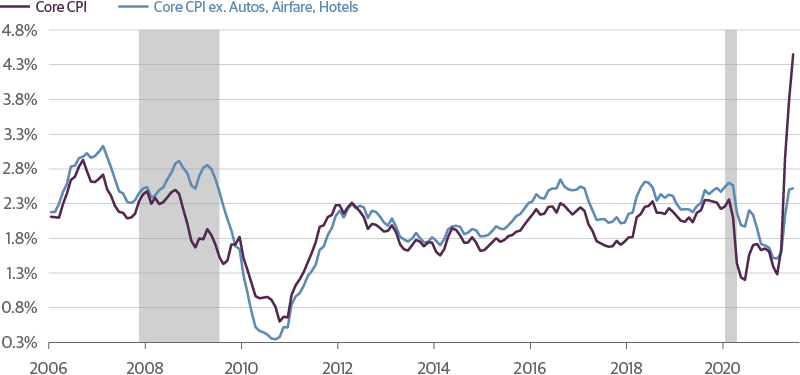
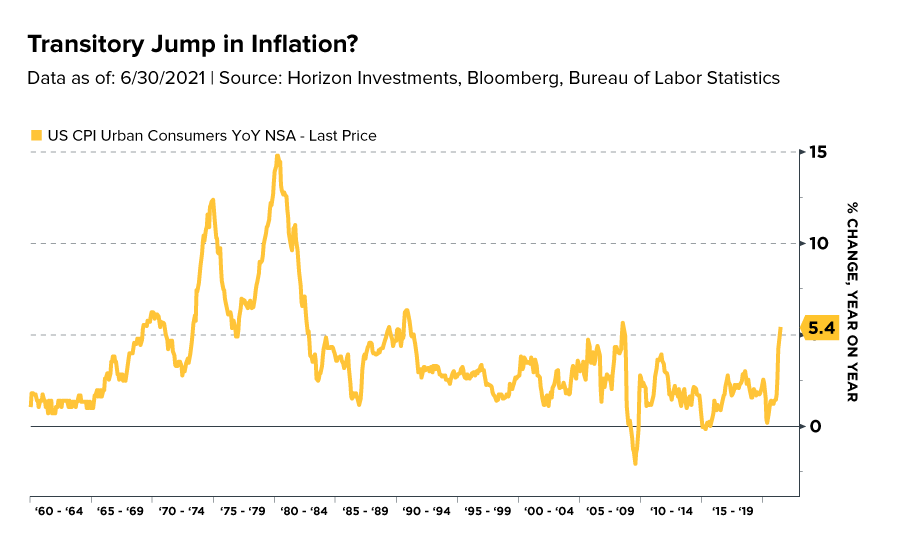
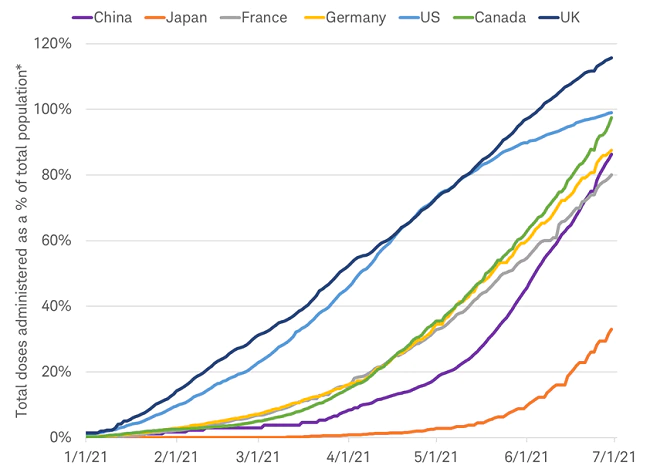
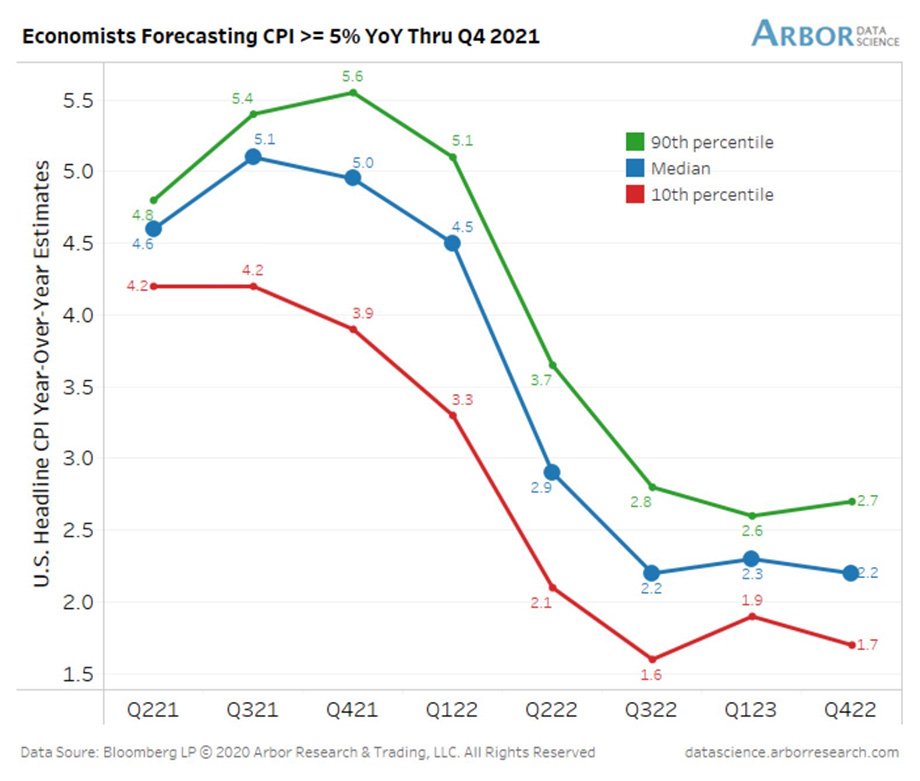
Inflation concerns are omnipresent. At last week’s Jackson Hole Summit, the Fed chair noted a “COVID-constrained supply side unable to keep up with demand,” leading to “elevated inflation in durable goods.” In other words: Yes, we’ve experienced higher prices, but the belief remains that these price increases will only be temporary. The Fed continues to reiterate that we are seeing inflation, especially in year-over-year comparisons, but as the world economy reopens, economists predict that inflation will fall to an acceptable level, as seen in the chart below.
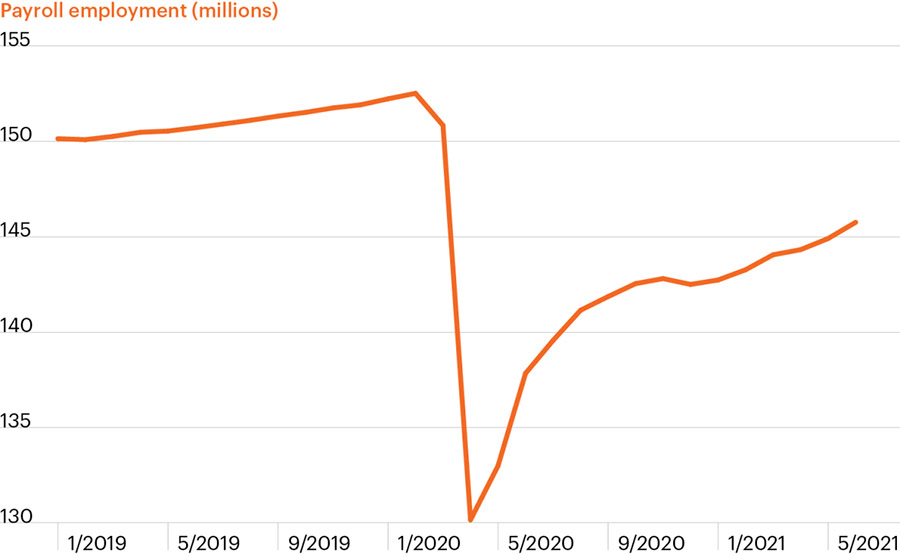
The jobs report last Friday delivered a big miss for August with only 235,000 new jobs. Leisure and hospitality added almost no new jobs after the last several months of more than 300,000 jobs. On a positive note, the unemployment rate dropped to 5.2%. This jobs report may influence when the Fed starts to taper and when it actually decides to raise rates; if job growth and the economy are slowing, the need to raise rates to slow down economic growth diminishes.
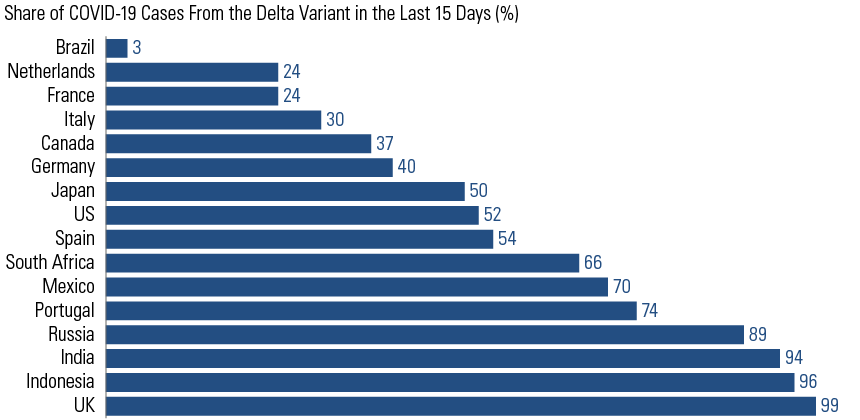
So, what can we learn from all this? There are many different economic indicators that can send mixed signals to the stock market. It is important not to focus only on one data point or one indicator, but to look at the big picture and follow economic trends. We continue to watch economic data closely and to monitor the COVID variants’ effect on the global economy and Federal Reserve policy, as well as China’s increased regulations and restrictions.
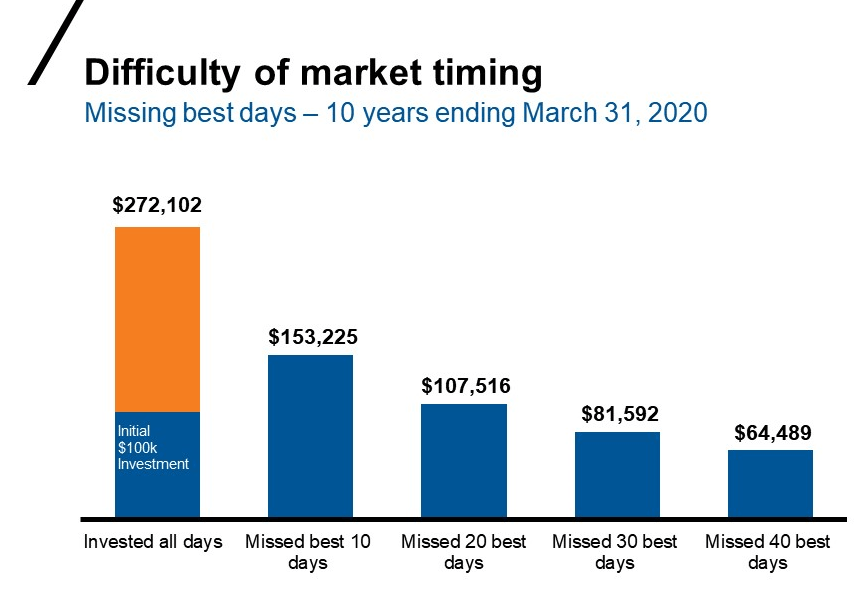
From a portfolio perspective, we continue to adhere to the tried-and-true disciplines of diversification, periodic rebalancing and looking forward, while not making investment decisions based on where we have been. Making market decisions based on what might happen may be detrimental to long-term performance. The key is to stay invested and stick with the financial plan. Markets go up and down over time, and downturns present opportunities to purchase stocks at a lower value.
It all starts with a solid financial plan for the long run that understands the level of risk that is acceptable for each client. Regarding investments, we believe in diversification and having different asset classes that allow you to stay invested. The best option is to stick with a broadly diversified portfolio that can help you to achieve your own specific financial goals — regardless of market volatility. Long-term fundamentals are what matter.
Sources: Arbor Data, Goldman Sachs, Horizon Asset Management, CNBC

This material contains an assessment of the market and economic environment at a specific point in time and is not intended to be a forecast of future events, or a guarantee of future results. Forward-looking statements are subject to certain risks and uncertainties. Actual results, performance, or achievements may differ materially from those expressed or implied. Information is based on data gathered from what we believe are reliable sources.
Using diversification as part of your investment strategy neither assures nor guarantees better performance and cannot protect against loss of principal due to changing market conditions.
Past performance is not a guarantee of future results.
The opinions expressed in this commentary are those of the author and may not necessarily reflect those held by Kestra Investment Services, LLC or Kestra Advisory Services, LLC. This is for general information only and is not intended to provide specific investment advice or recommendations for any individual. It is suggested that you consult your financial professional, attorney, or tax advisor with regard to your individual situation.
Securities offered through Kestra Investment Services, LLC (Kestra IS), member FINRA/SIPC. Investment Advisory Services offered through Kestra Advisory Services, LLC (Kestra AS) an affiliate of Kestra IS. Kestra IS and Kestra AS are not affiliated with CD Wealth Management. Investor Disclosures: https://bit.ly/KF-Disclosures