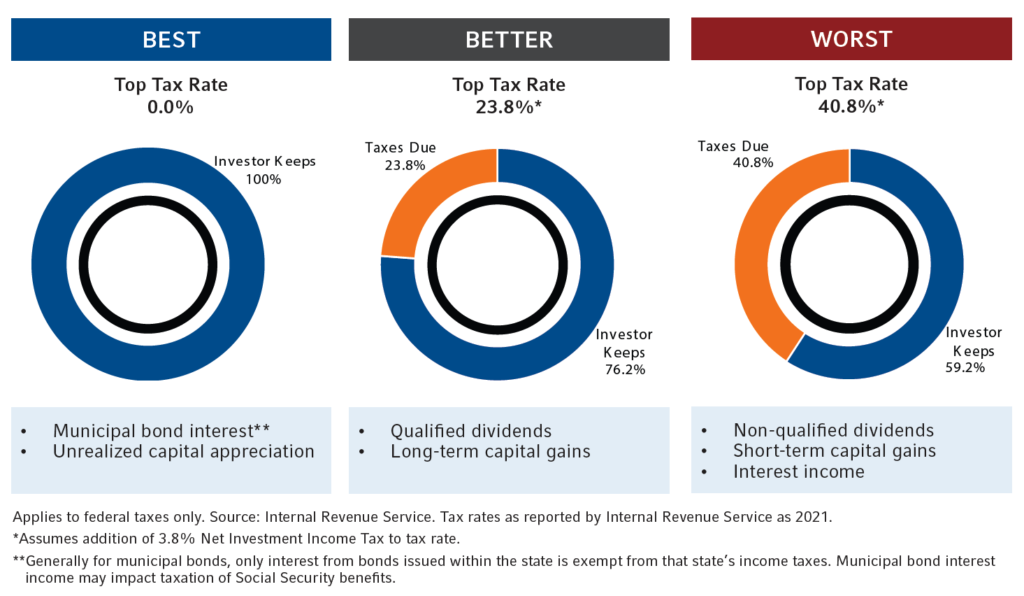
The bond market has been anything but sleepy to start the year. With inflation at its hottest level since the early 1980s and the Federal Reserve raising rates, the U.S. Treasury index had its worst start ever to the year. Historically, bonds provide diversification from equities during volatile markets. However, during the first quarter of 2022, bonds declined in tandem with stocks and have not provided the portfolio with the cushion that investors expect.
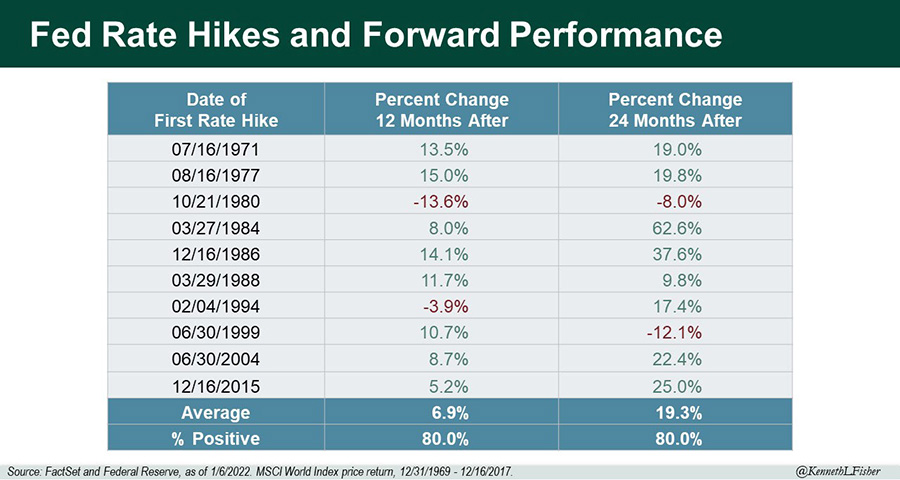
With more rate hikes coming this year, investors may be tempted to avoid bonds altogether. Historical returns suggest that even with the current headwinds of inflation and rising rates, bonds can still provide positive returns in an environment of rising interest rates.
What has caused bond prices to decrease?
Bond prices have an inverse relationship with interest rates. When interest rates rise, bond prices fall — and vice versa. For example: If interest rates are 0% and someone offers you a bond that has a 5% coupon, you would have to pay a premium to get the 5% income. However, if interest rates were to rise to 2% and that same person offered you the same bond, you would have to pay a smaller premium, because the price of the bond falls as the interest rate rises.
The Russia-Ukraine war has led to higher energy prices and higher commodity prices for wheat and corn. These increases put additional pressure on the Federal Reserve Bank to stabilize inflation and economic growth. As a result, selling in the bond market is taking place as the market anticipates the Fed raising rates an additional six times this year.
Amid such headwinds, why own bonds?
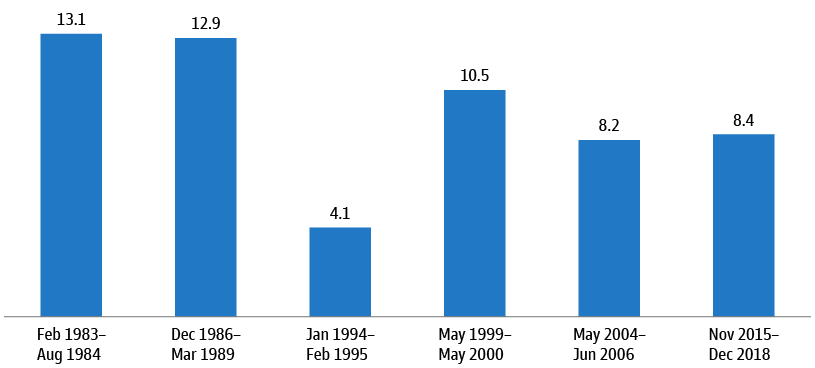
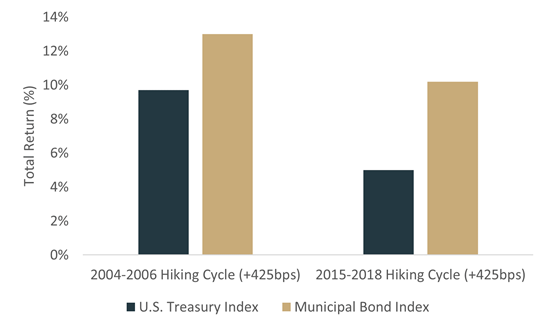
Bonds have historically provided an important buffer for portfolios during stock market downturns and corrections. In February and March of 2020, the S&P 500 index fell by almost 33% in a short period of time. As stocks fell, the Bloomberg U.S. Aggregate Bond Index rose, finishing 2020 up more than 7%. Bonds also have provided positive returns even as rates were being raised. During two of the most recent hiking cycles, both U.S. Treasuries and municipal bonds saw strong gains on a total return basis, as seen in the chart below.
How Bonds Have Performed When the Fed Was Raising Rates
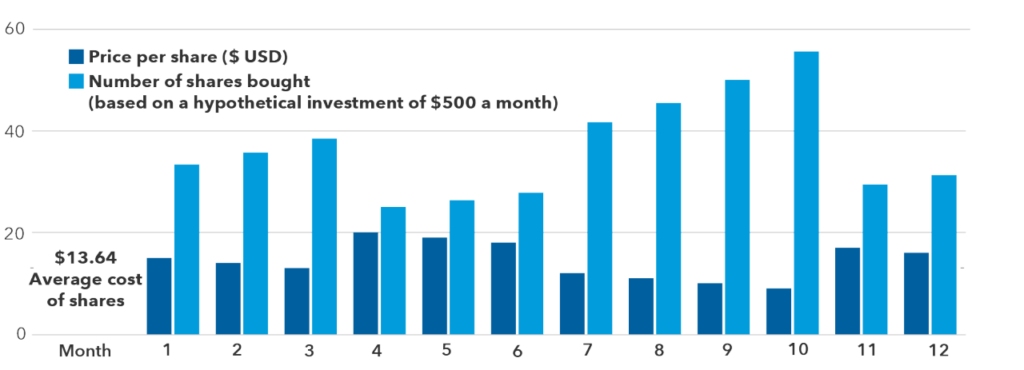
The longer the maturity of the bond or bond fund, the more sensitive the bonds are to interest rate changes. Diversification across maturities, sectors and credit risk can help mitigate portfolio risk during this more than volatile time in the bond market. For those who own individual bonds, rising rates present opportunities to purchase newer bonds as the current bonds are either called or redeemed. New bonds bring higher levels of interest income and potentially greater returns. In other words, rising rates may create some short-term pain but ultimately translate into longer-term gains.
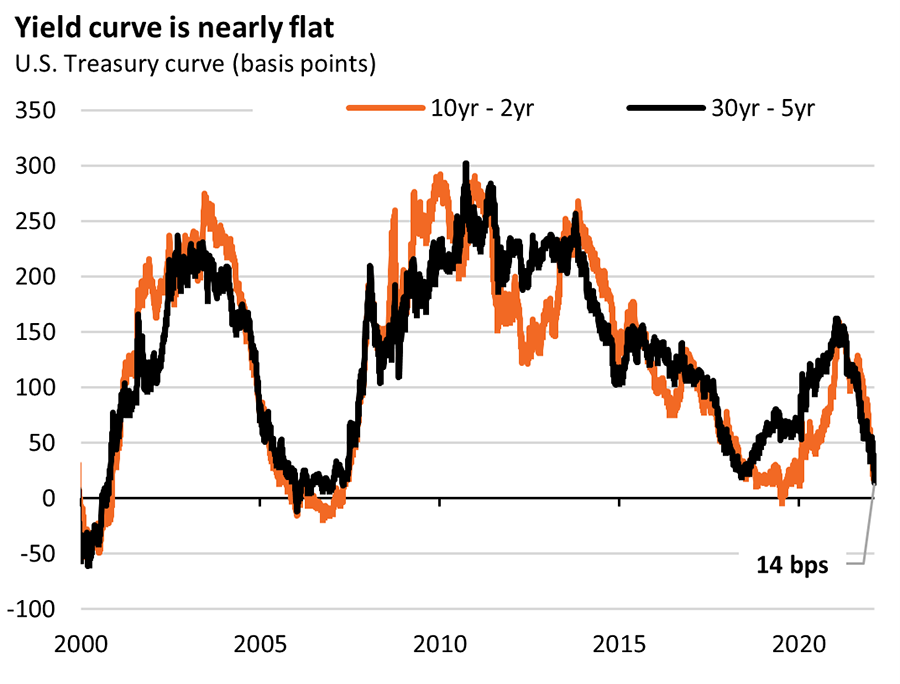
So, what can we learn from all this? While every rising rate cycle may be different, fixed income has had positive returns most of the time during years of rising rates. Last week, we saw the yield curve invert for the first time since 2019. Remember, a recession is not a foregone conclusion. Even if a recession occurs in the next six months to two years, the stock market and bond market may continue to experience positive returns.
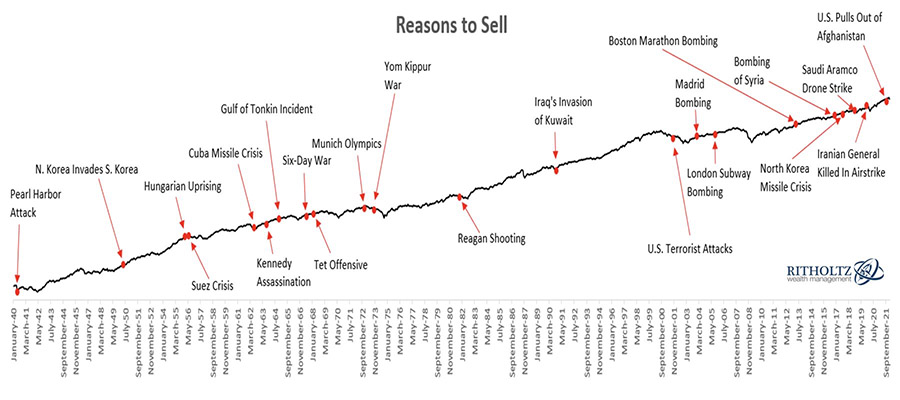
From a portfolio perspective, we continue to adhere to the tried-and-true disciplines of diversification, periodic rebalancing and looking forward, while not making investment decisions based on where we have been. As we say each week, it is important to stay the course and focus on the long-term goal, not on one specific data point or indicator. In markets and moments like these, it is essential to stick to the financial plan. Remember, first and foremost, that panic is not an investing strategy. Neither are “get in” or “get out” — those are just gambling on moments in time. Investing is about following a disciplined process over time.
At the end of the day, investors will be well-served to remove emotion from their investment decisions and remember that over a longer time horizon, markets tend to rise. Market corrections are normal, as nothing goes up in a straight line. Making market decisions based on what might happen may be detrimental to long-term performance. The key is to stay invested and stick with the financial plan. Markets go up and down over time, and downturns present opportunities to purchase stocks at a lower value.
It all starts with a solid financial plan for the long run that understands the level of risk that is acceptable for each client. Regarding investments, we believe in diversification and having different asset classes that allow you to stay invested. The best option is to stick with a broadly diversified portfolio that can help you to achieve your own specific financial goals — regardless of market volatility. Long-term fundamentals are what matter.
Sources: Kestra Financial, Bloomberg

This material contains an assessment of the market and economic environment at a specific point in time and is not intended to be a forecast of future events, or a guarantee of future results. Forward-looking statements are subject to certain risks and uncertainties. Actual results, performance, or achievements may differ materially from those expressed or implied. Information is based on data gathered from what we believe are reliable sources.
Using diversification as part of your investment strategy neither assures nor guarantees better performance and cannot protect against loss of principal due to changing market conditions.
Past performance is not a guarantee of future results.
The opinions expressed in this commentary are those of the author and may not necessarily reflect those held by Kestra Investment Services, LLC or Kestra Advisory Services, LLC. This is for general information only and is not intended to provide specific investment advice or recommendations for any individual. It is suggested that you consult your financial professional, attorney, or tax advisor with regard to your individual situation.
Securities offered through Kestra Investment Services, LLC (Kestra IS), member FINRA/SIPC. Investment Advisory Services offered through Kestra Advisory Services, LLC (Kestra AS) an affiliate of Kestra IS. CD Wealth Management and Bluespring Wealth Partners LLC* are affiliates of Kestra IS and Kestra AS. Investor Disclosures: https://bit.ly/KF-Disclosures
*Bluespring Wealth Partners, LLC acquires and supports high quality investment adviser and wealth management companies throughout the United States.