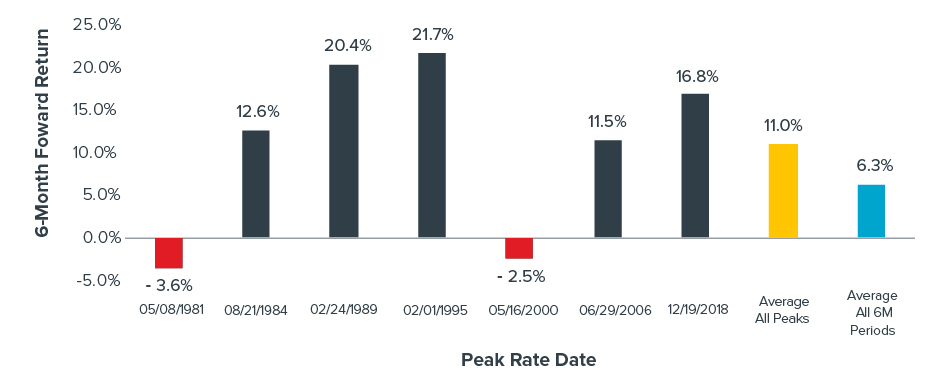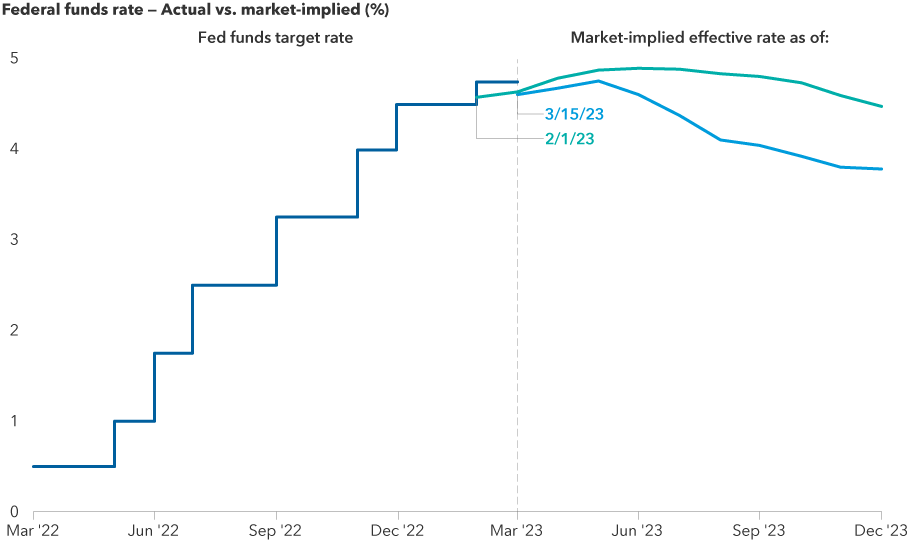
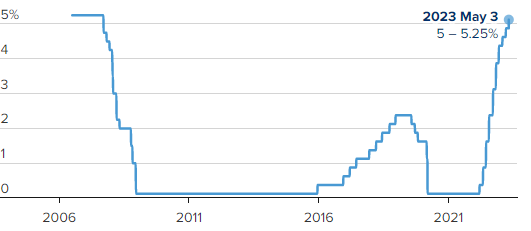
Last week, the Federal Reserve bank raised interest rates another 25 basis points (0.25 percentage point), taking the Fed Funds rate to 5%. This was the 10th time the Fed has raised rates since March 2022. However, this time the Fed hinted that the tightening cycle is nearing or at an end. The Fed has made no indication that it will reduce rates anytime soon, and some Fed governors are still talking about possible rate hikes. Still, the stock and bond markets are signaling that they will probably begin to reduce interest rates later this year or early next year.
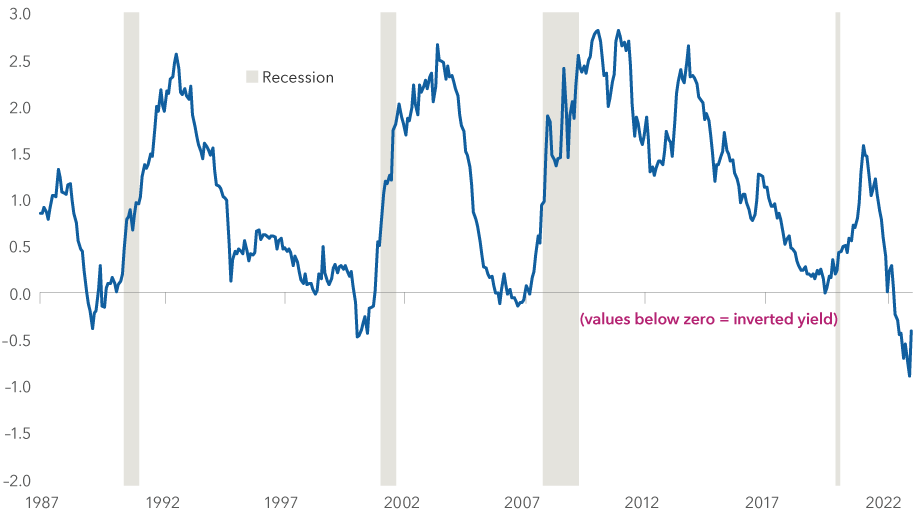
Federal Funds Target Rate Crests 5%
The range hasn’t been this high since August 2007.
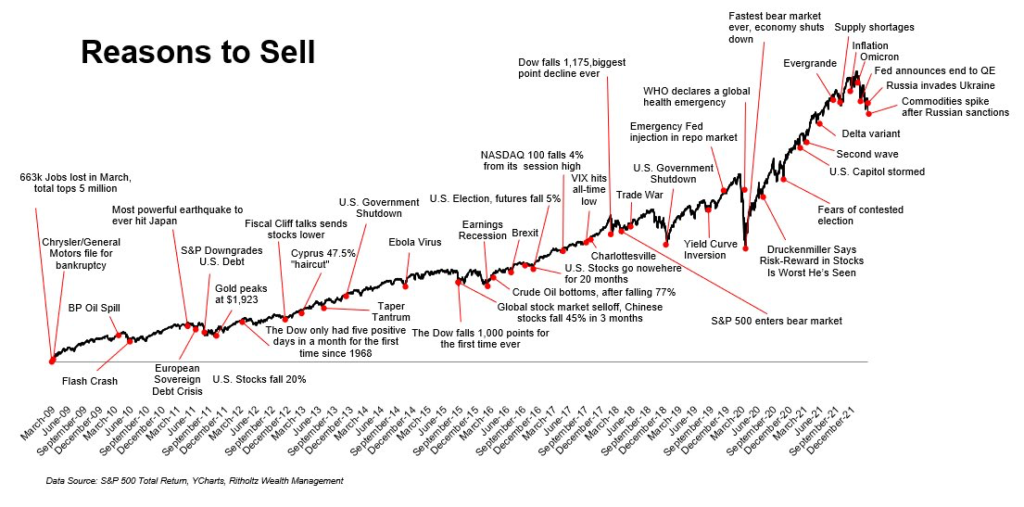
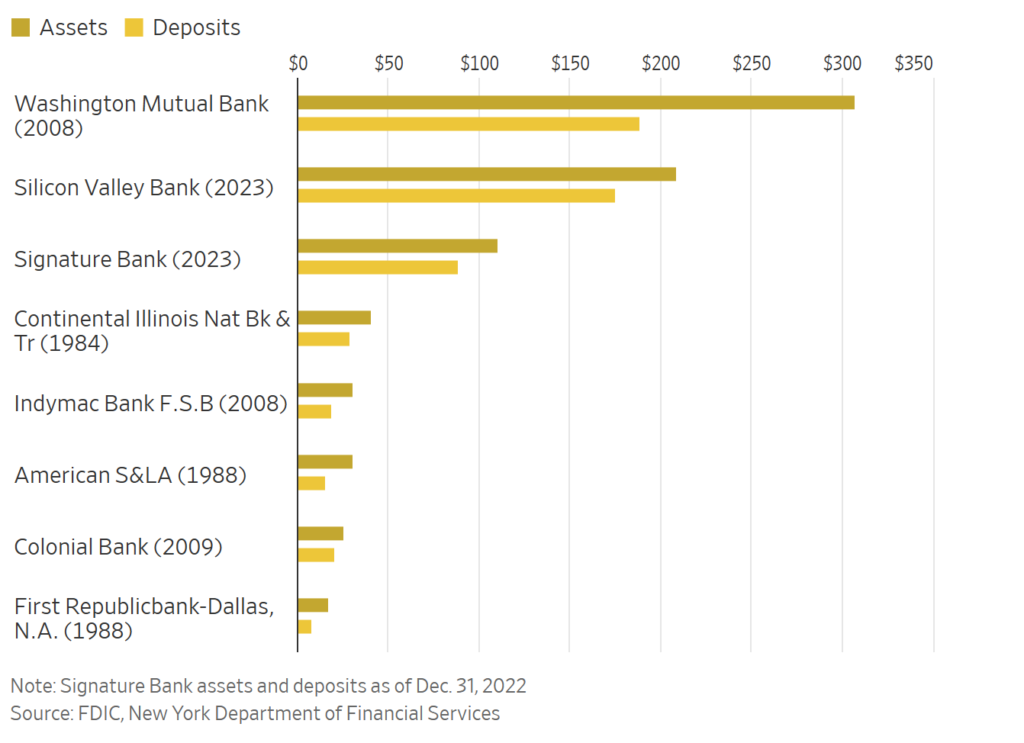
In the face of higher interest rates, the stock market has continued to hang tough despite continued regional bank worries with First Republic Bank failing last week and increasing concern about the commercial real estate market. Over the last month, the S&P 500 has remained steady and traded in a narrow range. What might surprise you is that going back over the past 52 weeks, the S&P 500 was virtually flat, despite the negative headlines of record high inflation, a bond market crash, aggressive Fed hikes, the war in Ukraine, lockdowns in China and two of the three largest bank failures ever.
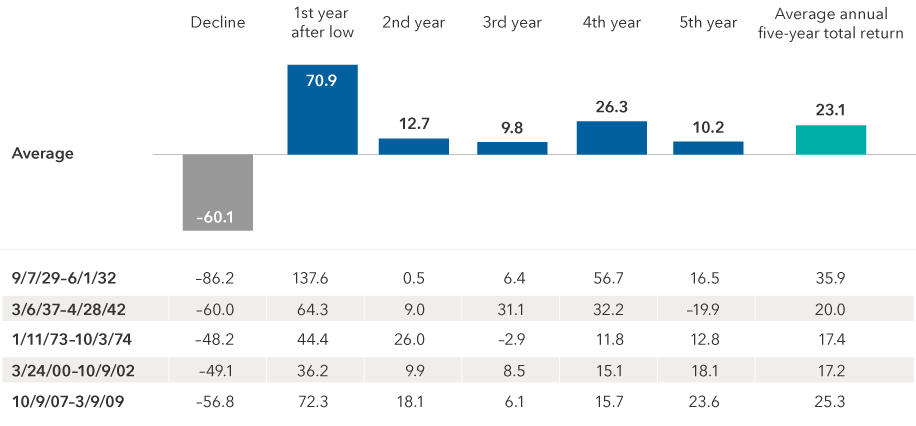
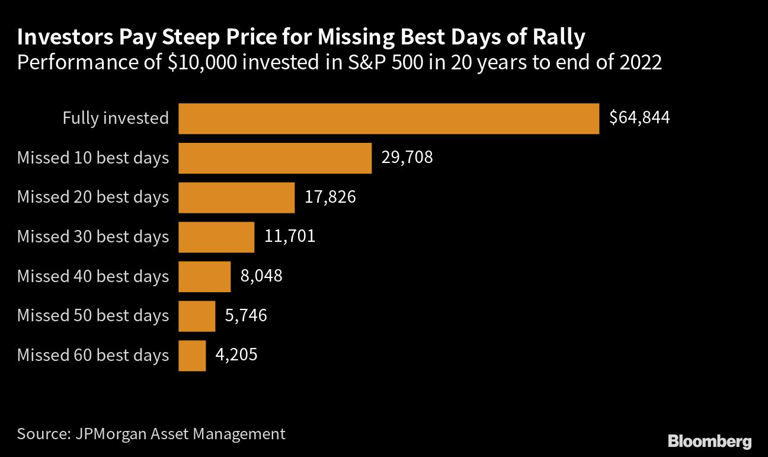
That is not to say that there hasn’t been volatility over the past year, but as we always preach, staying invested pays off. If you chose to get out back in October, when the market was hitting its bottom, you would have missed the market’s move to get back to where you were last May. The chart below is another strong reminder why we advocate for staying invested, especially when times are the toughest.
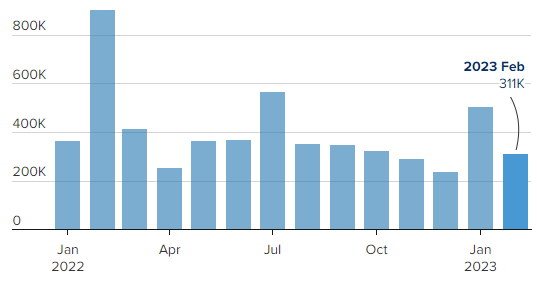
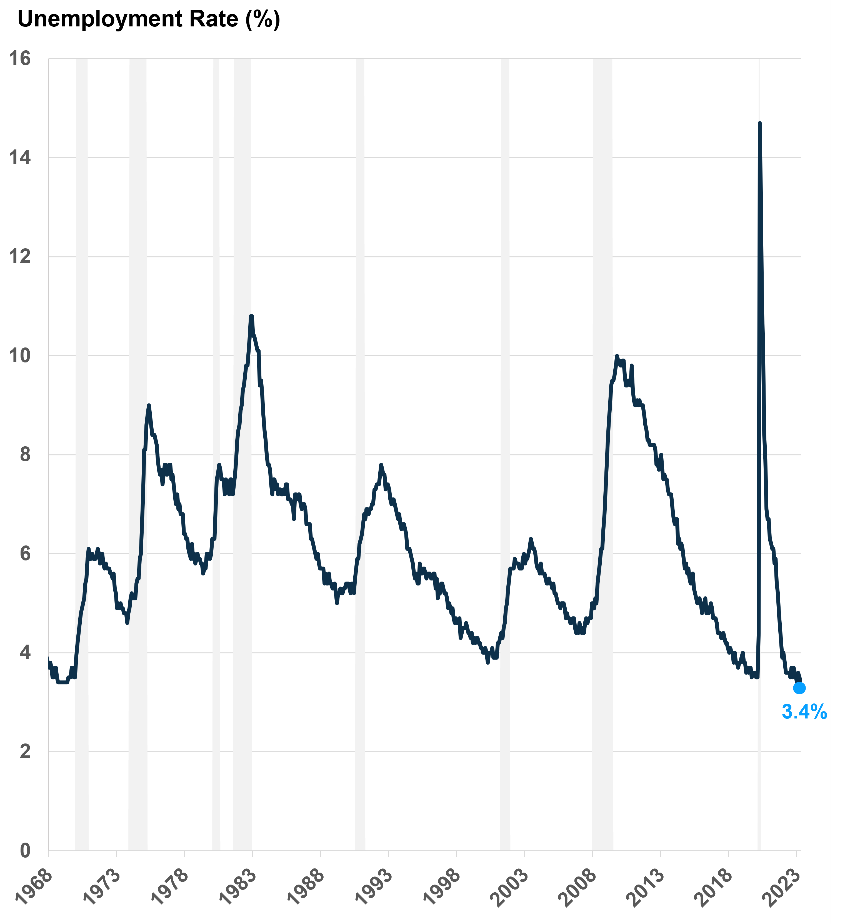
The April employment data suggests that the economy remains strong and resilient. The economy created 253,000 jobs in April, well above economists’ expectations. For the first four months of 2023, the economy created more than 1.1 million jobs. The unemployment rate has fallen to 3.4%, the lowest level since 1969!
The biggest reason that the employment picture matters is that consumption makes up about 70% of the economy. Consumption is driven by income, and income is made up of strong employment, wage growth and hours worked. Even better news is that income growth is running above inflation. That means people have more money in their pockets, which is a positive for the economy.
Unemployment Rate at Lowest Level Since 1969
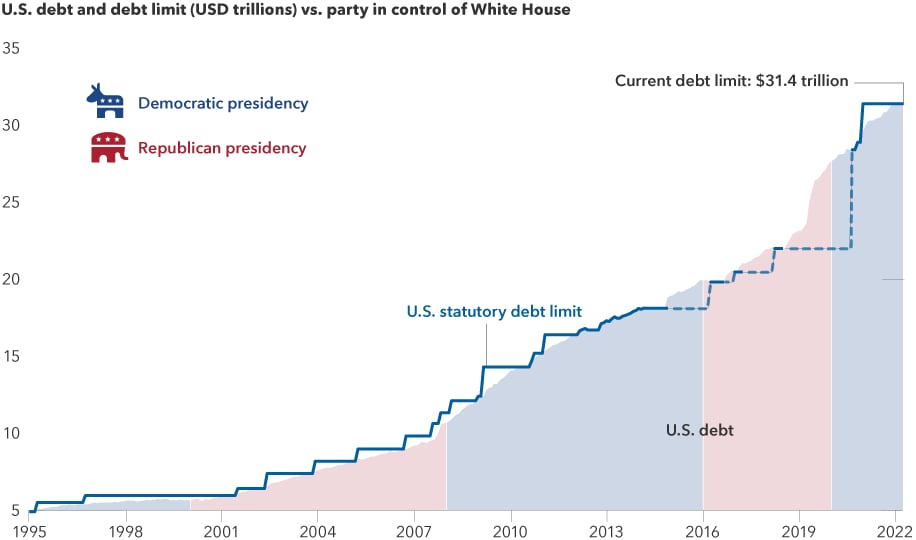
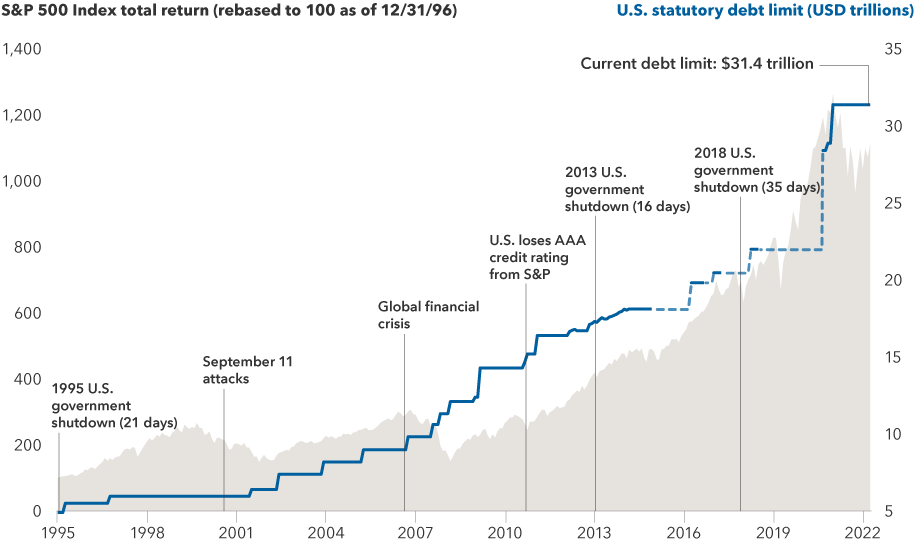
There is no sign of an economic slowdown yet, with one big caveat: the debt ceiling. As we wrote recently, all eyes are on the debt-ceiling negotiations, and the clock is ticking. Treasury Secretary Janet Yellen informed Congress last week that cash balances are estimated to be depleted by early June. The Senate, House and President Biden have seven calendar days of overlap for discussion before then.
Days With House and Senate in Session and President Biden Available
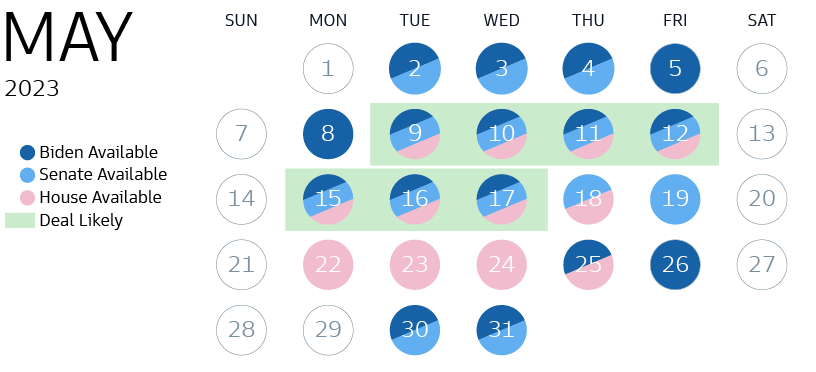
We remain hopeful that a resolution will be reached, though political games raise the likelihood of a time-sensitive outcome, possibly with the need to extend the deadline. Should there be a need to extend the deadline, there may be additional volatility. We will continue to monitor the negotiations and the economy closely and keep you informed.
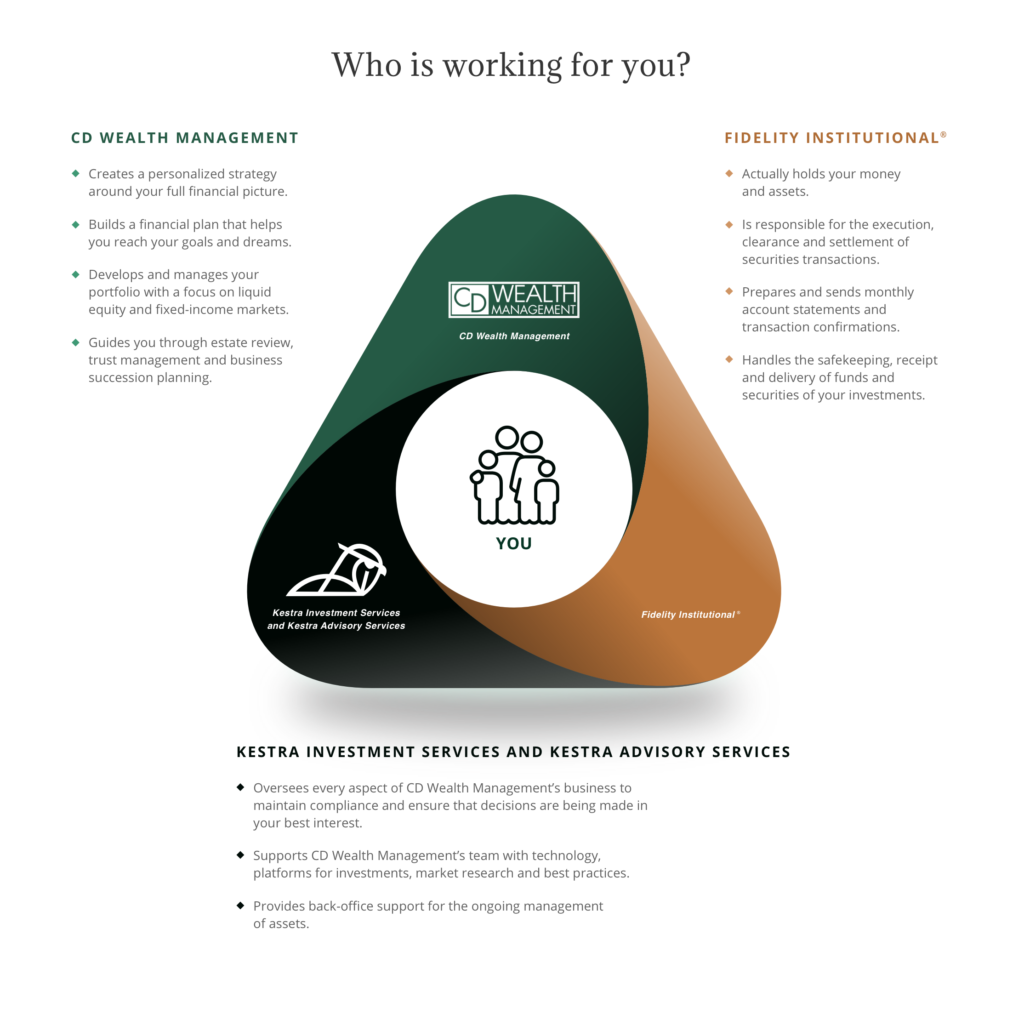
The CD Wealth Formula
We help our clients reach and maintain financial stability by following a specific plan, catered to each client.
Our focus remains on long-term investing with a strategic allocation while maintaining a tactical approach. Our decisions to make changes are calculated and well thought out, looking at where we see the economy is heading. We are not guessing or market timing. We are anticipating and moving to those areas of strength in the economy — and in the stock market.
We will continue to focus on the fact that what really matters right now is time in the market, not out of the market. That means staying the course and continuing to invest, even when the markets dip, to take advantage of potential market upturns. We continue to adhere to the tried-and-true disciplines of diversification, periodic rebalancing and looking forward, while not making investment decisions based on where we have been.
It is important to focus on the long-term goal, not on one specific data point or indicator. Long-term fundamentals are what matter. In markets and moments like these, it is essential to stick to the financial plan. Investing is about following a disciplined process over time.
Sources: Bloomberg, Carson, CNBC, JP Morgan

This material contains an assessment of the market and economic environment at a specific point in time and is not intended to be a forecast of future events, or a guarantee of future results. Forward-looking statements are subject to certain risks and uncertainties. Actual results, performance, or achievements may differ materially from those expressed or implied. Information is based on data gathered from what we believe are reliable sources.
Using diversification as part of your investment strategy neither assures nor guarantees better performance and cannot protect against loss of principal due to changing market conditions.
Past performance is not a guarantee of future results.
The opinions expressed in this commentary are those of the author and may not necessarily reflect those held by Kestra Investment Services, LLC or Kestra Advisory Services, LLC. This is for general information only and is not intended to provide specific investment advice or recommendations for any individual. It is suggested that you consult your financial professional, attorney, or tax advisor with regard to your individual situation.
Securities offered through Kestra Investment Services, LLC (Kestra IS), member FINRA/SIPC. Investment Advisory Services offered through Kestra Advisory Services, LLC (Kestra AS) an affiliate of Kestra IS. CD Wealth Management and Bluespring Wealth Partners LLC* are affiliates of Kestra IS and Kestra AS. Investor Disclosures: https://bit.ly/KF-Disclosures
*Bluespring Wealth Partners, LLC acquires and supports high quality investment adviser and wealth management companies throughout the United States.
Fidelity Investments and Fidelity Institutional® (together “Fidelity”) is an independent company, unaffiliated with Kestra Financial or CD Wealth Management. Fidelity is a service provider to both. There is no form of legal partnership, agency affiliation, or similar relationship between your financial advisor and Fidelity, nor is such a relationship created or implied by the information herein. Fidelity has not been involved with the preparation of the content supplied by CD Wealth Management and does not guarantee, or assume any responsibility for, its content. Fidelity Investments is a registered service mark of FMR LLC. Fidelity Institutional provides clearing, custody, or other brokerage services through National Financial Services LLC or Fidelity Brokerage Services LLC, Members NYSE, SIPC.